| WC Tornado Center
View the latest weather models for predicting tornado risk in North Texas today
Today’s Weather Sounding
Weather Sounding Info
🎈 What Is a Weather Sounding?
A weather sounding is a vertical profile of the atmosphere captured by a weather balloon, officially called a radiosonde. These balloons are launched 2–3 times daily by National Weather Service offices nationwide, and collect crucial upper-air measurements:
- 🌡️ Temperature
- 💧 Dewpoint and moisture
- 🌬️ Wind speed and direction
- 🌪️ Shear, instability, and storm ingredients
This data is plotted into a sounding chart, like the one shown below, which can be difficult to interpret at first glance. WC Tornado Center will soon offer a “How to Read a Weather Sounding” guide to help beginners master the visuals.
🔍 Tornado Forecasting: What to Look For
Meteorologists examine weather soundings to assess the potential for severe storms and tornadoes. Here’s what you should be scanning for:
🔥 Atmospheric Instability
- MU CAPE (Most Unstable CAPE) Ideal values: 2500+ J/kg Indicates available energy for thunderstorm updrafts. The higher, the more explosive the storms.
- K-Index ≥ 26 A simple measure of thunderstorm potential.
- Lifted Index (LI ≤ -4) Tells how buoyant rising air parcels are. More negative = stronger lift.
- Effective Layer CAPE (ELCAPE) CAPE based on the storm’s likely layer of development. Values >2000 J/kg suggest strong instability.
- Convective Temperature The surface temperature required to initiate thunderstorms. If forecast highs exceed this, storm initiation is likely.
- LCL Height (Lifted Condensation Level) <1000 m is ideal for tornado formation — low cloud bases help sustain rotation near ground level.
💨 Wind Shear & Rotation
- Hodograph Critical Angle ≈ 90° A near-right angle between low-level wind and storm inflow supports rotating updrafts.
- BRN Shear = 20–45 m/s Assesses storm organization potential. Sweet spot for supercell development.
-
Storm-Relative Helicity (SRH)
- 0–1 km SRH > 150 m²/s²
- 0–3 km SRH > 250 m²/s² Both indicate strong potential for rotating storms and tornadoes.
- Effective Bulk Wind Difference (EBWD) Values >40 knots point to favorable deep-layer shear.
- Energy-Helicity Index (EHI > 2) Combines instability and rotation. EHI values >4 are especially tornado-conducive.
🚫 Suppression vs. Activation
-
Convective Inhibition (CIN) Overlapping of the red temperature line with the brown parcel ascent line at the surface indicates CIN (also called Inverse CAPE).
- CIN < -50 J/kg is often breakable.
- CIN > -100 J/kg can suppress convection unless strong forcing exists.
🚨 Composite Parameters
-
Significant Tornado Parameter (STP) Combines moisture, instability, shear, and cloud base height.
- STP > 1 = enhanced tornado risk
- STP > 2 = concern for significant tornadoes
-
Supercell Composite Parameter (SCP)
- SCP > 1 supports supercell development.
- SARS Sounding Analogs Historical matches can signal environments favorable for SUPERCELLS and SIGNIFICANT HAIL.
-
Highlighted Risk Zones (on sounding overlays):
- Supercell, Left Supercell, STP, Sig Hail Color coding in orange or red means these hazards are strongly supported by the environment.
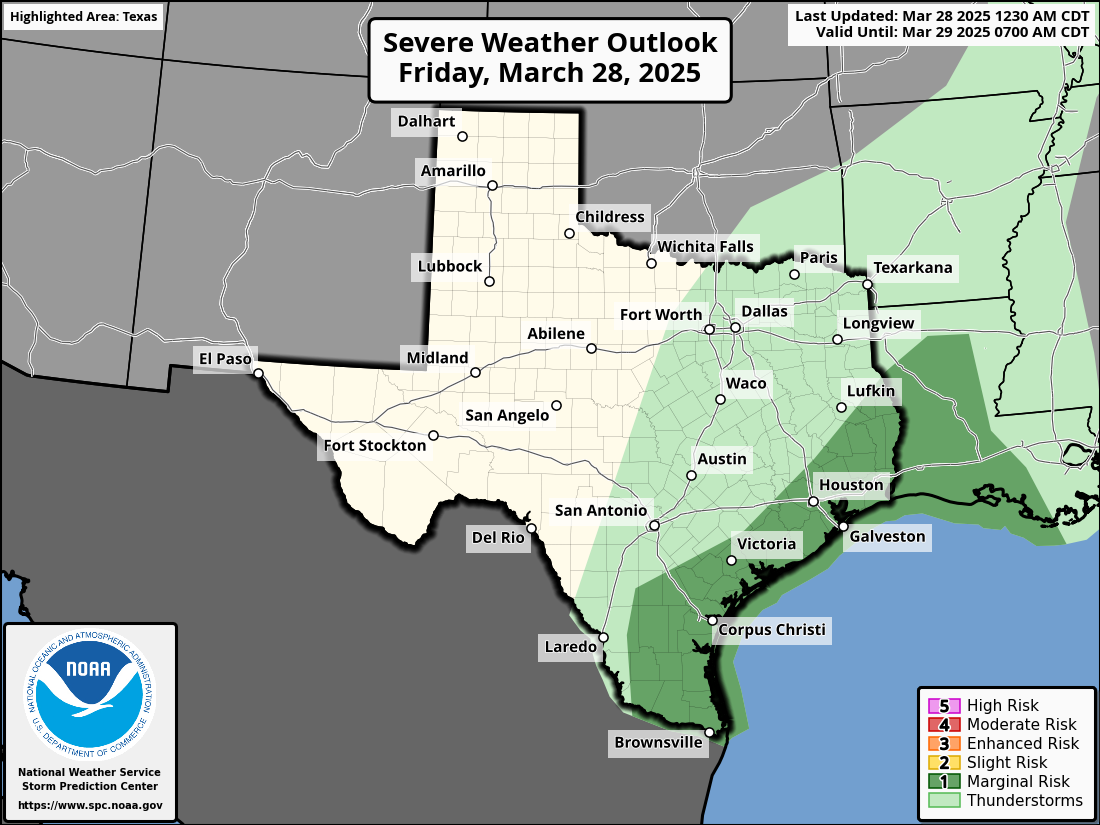
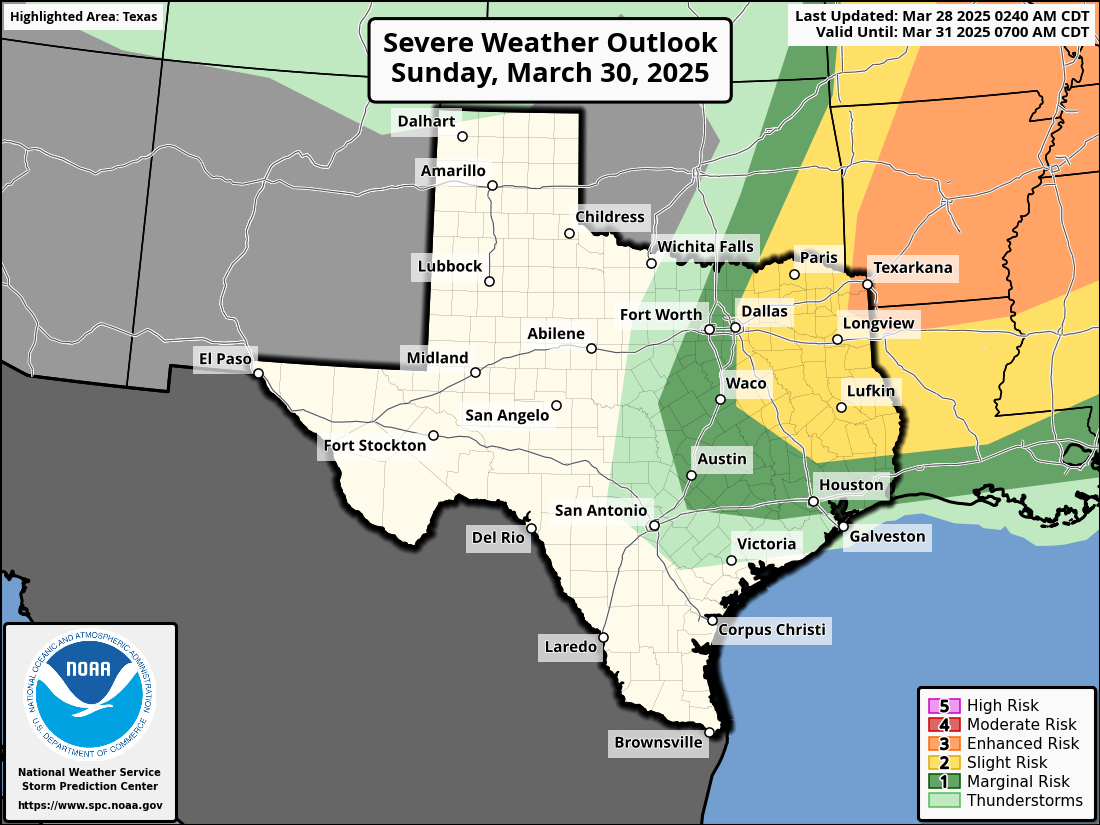
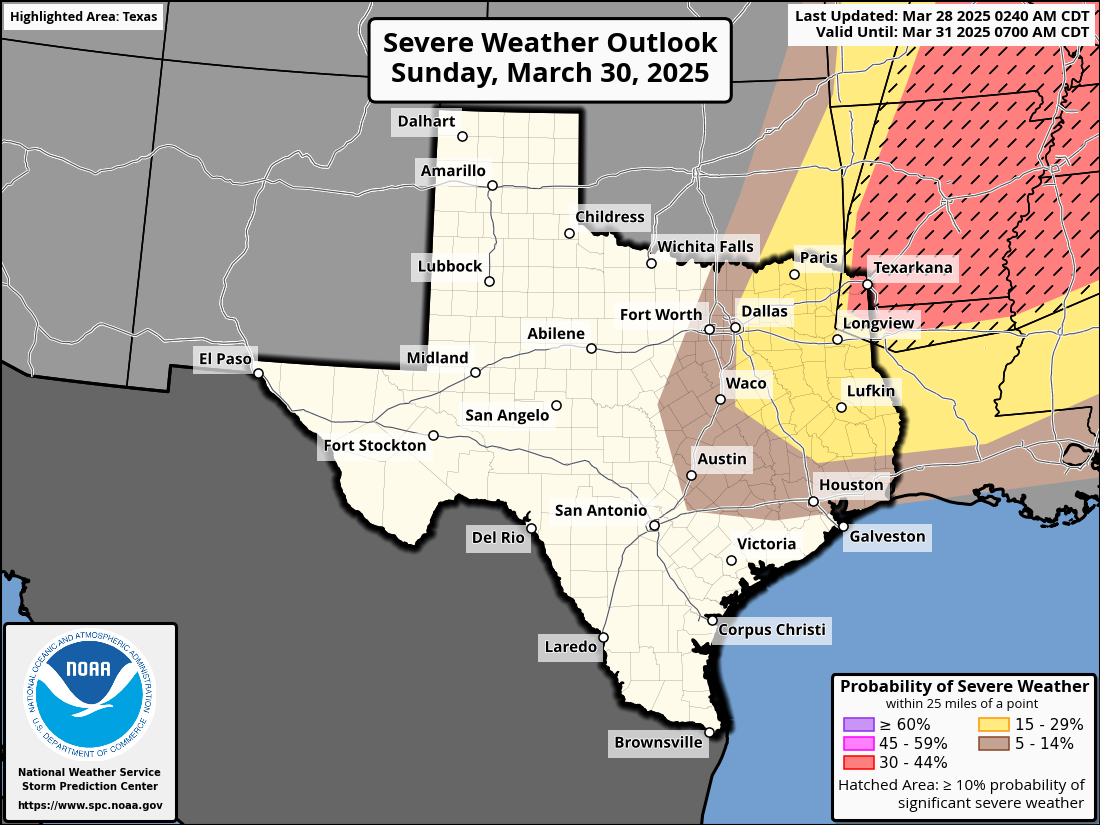
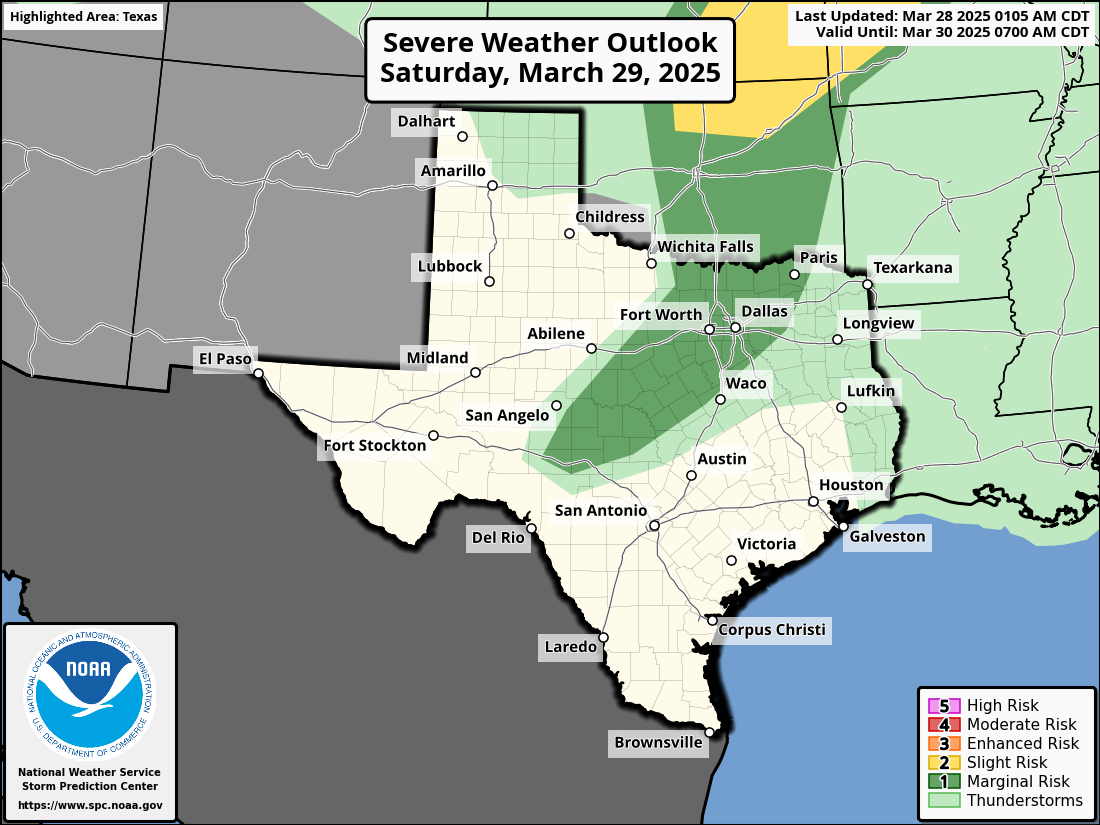
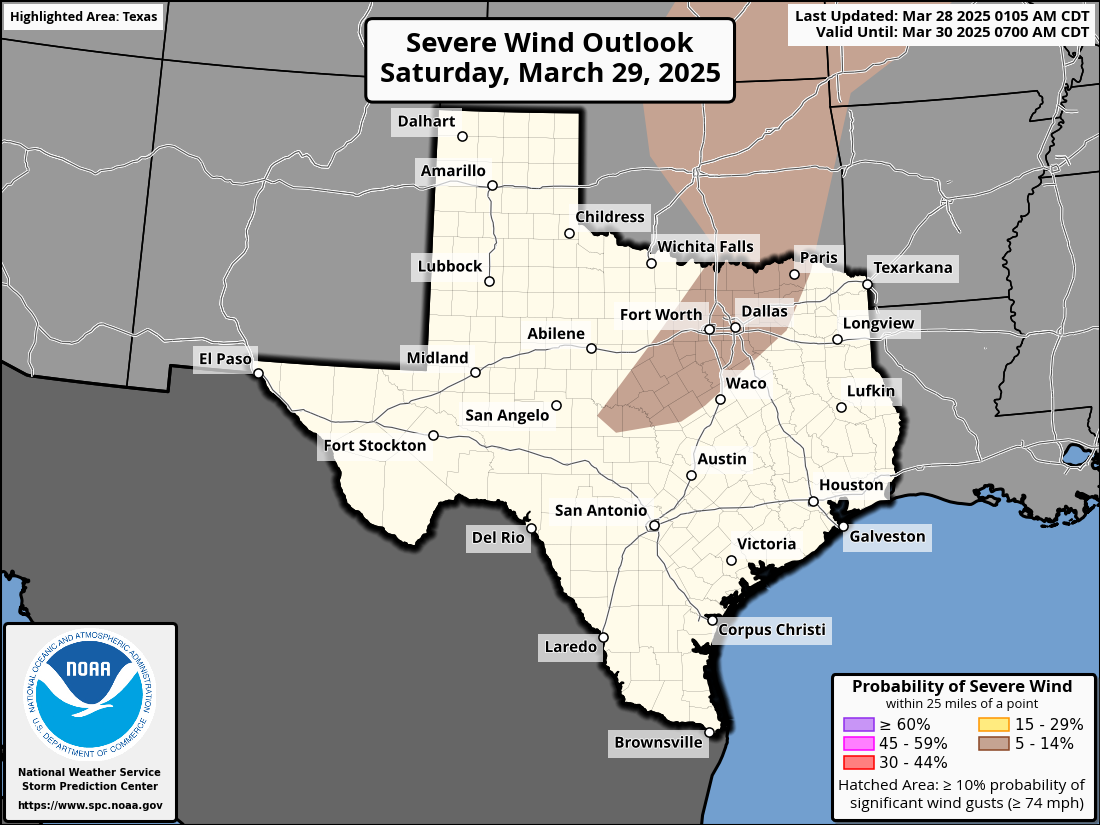
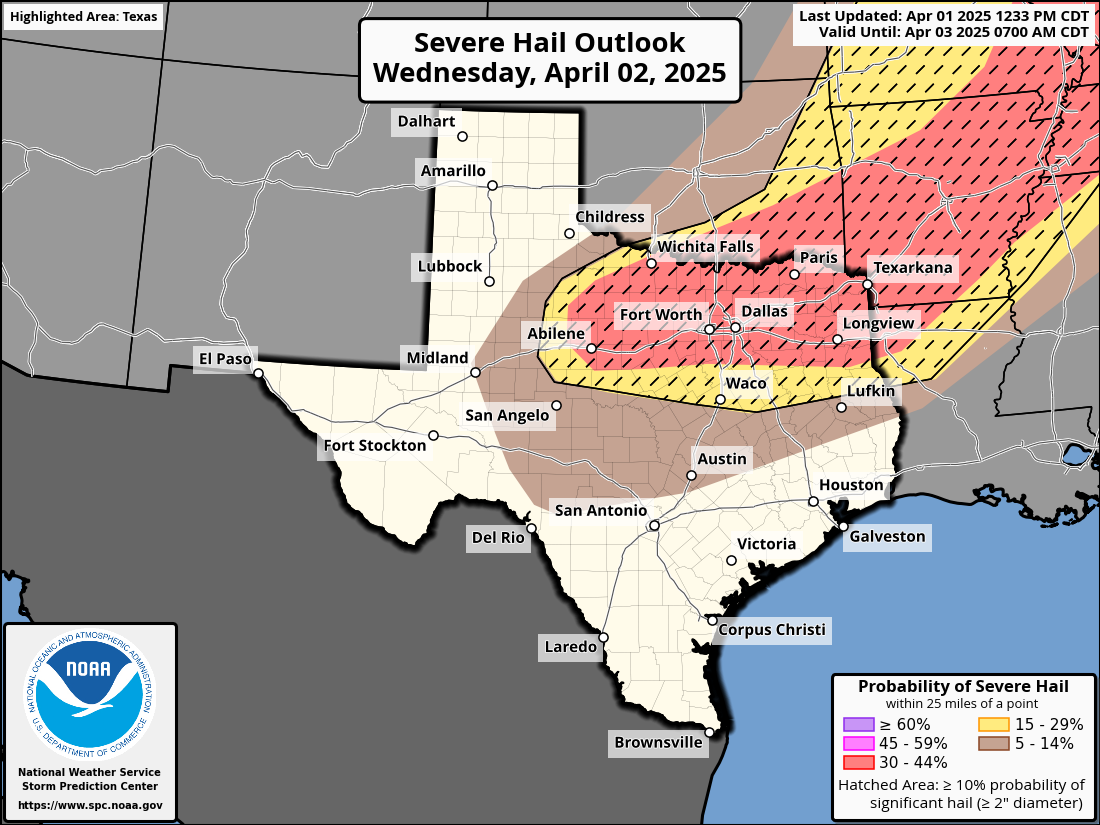
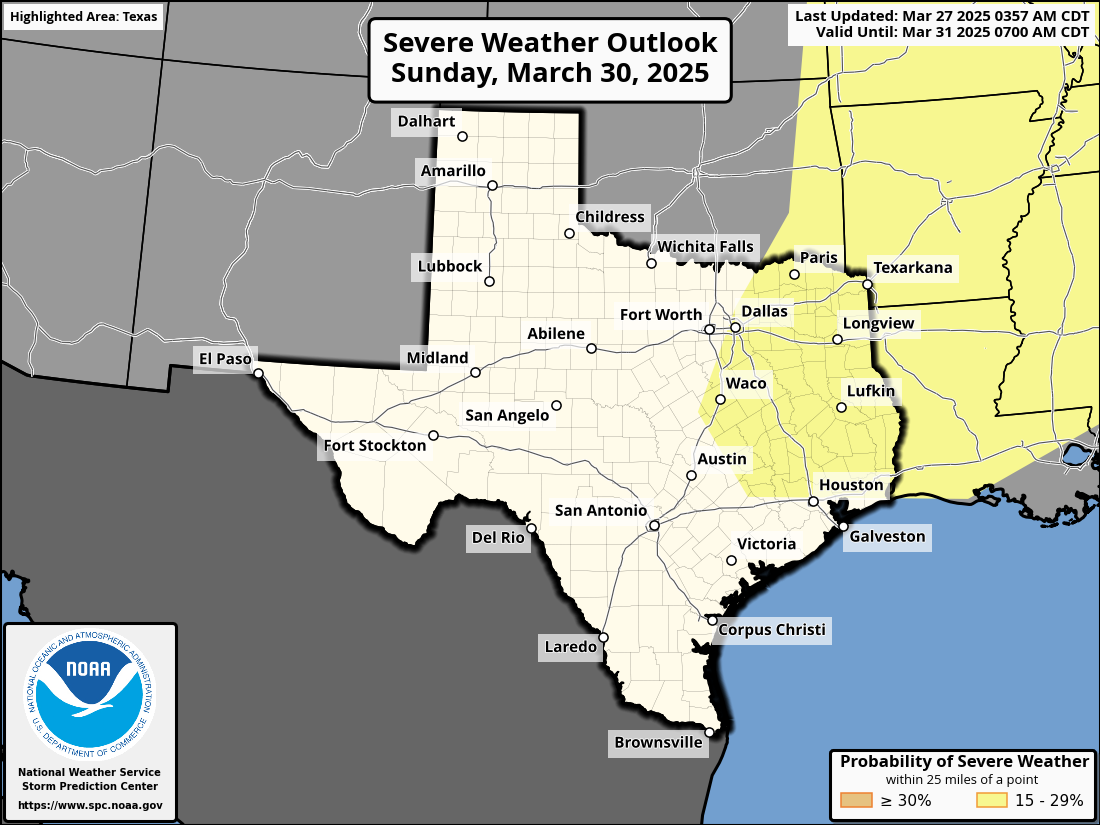
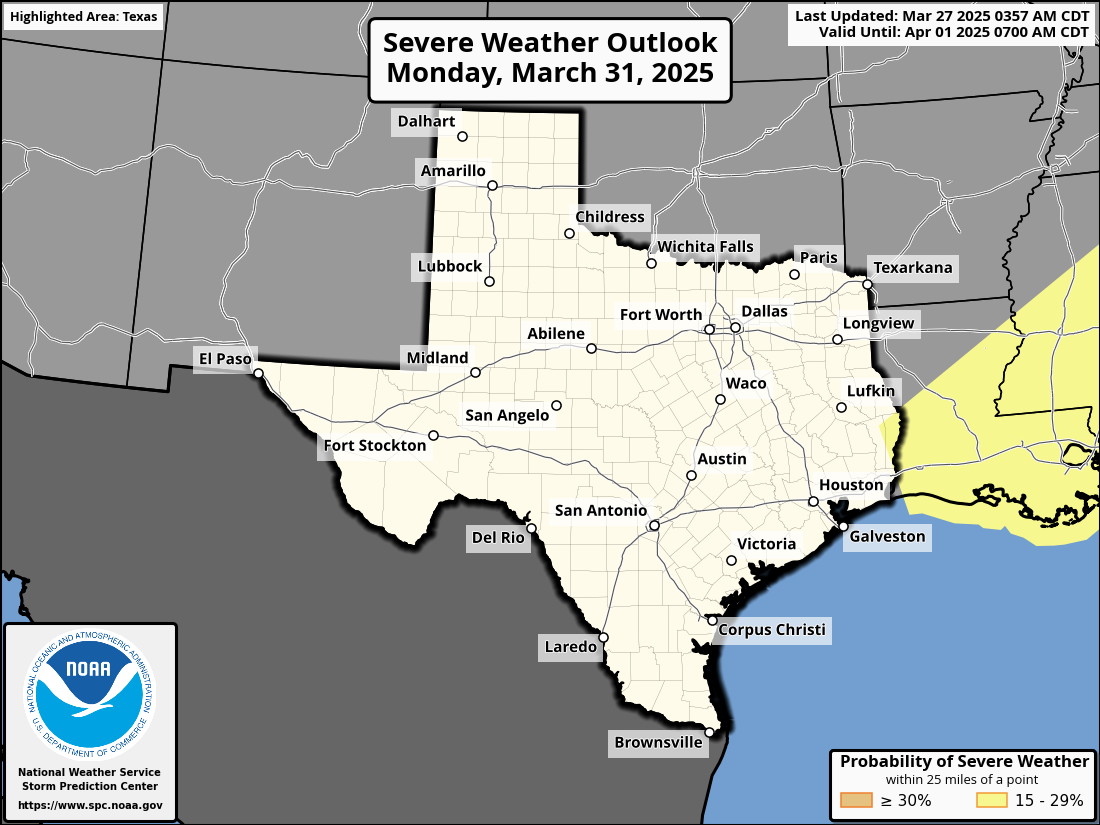
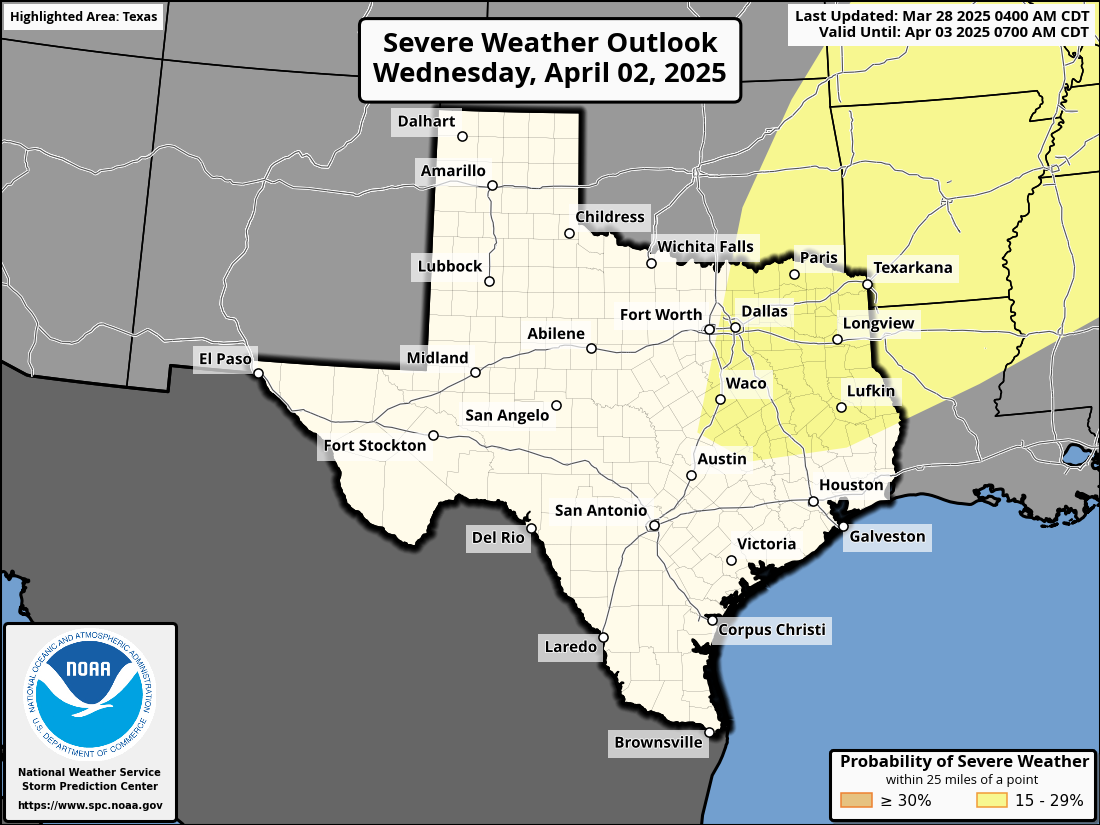
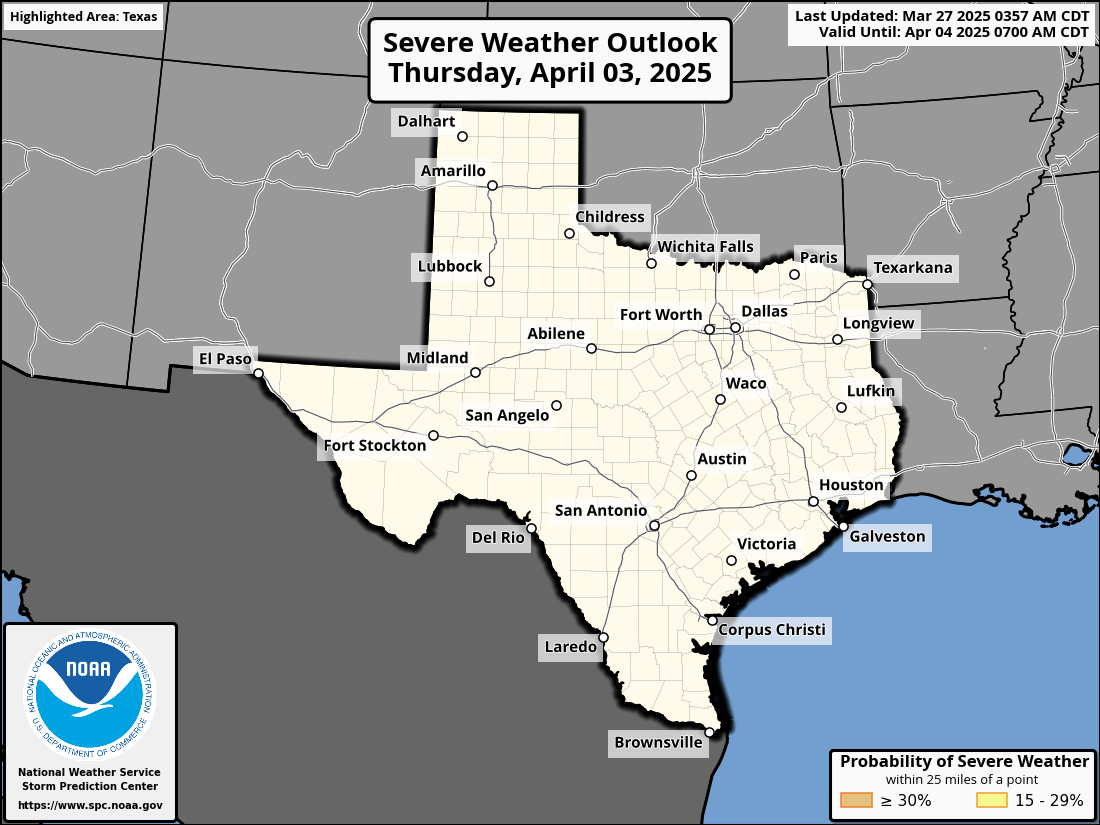
| Convective Outlooks
Know severe weather chances for the days ahead in North Texas
Understanding SPC Outlooks
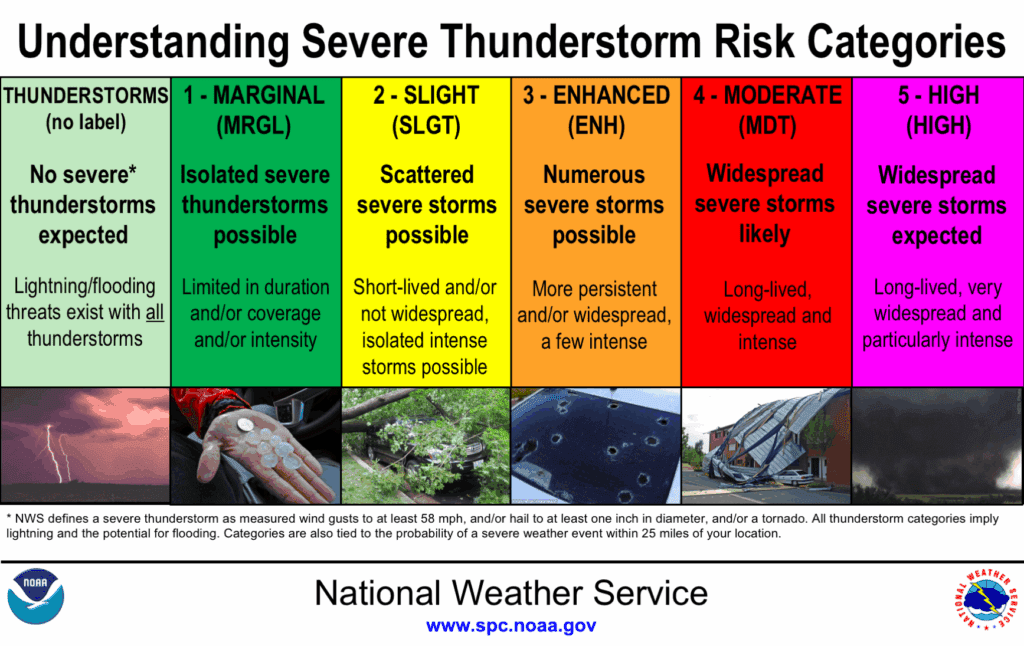
🟢 Thunderstorms
- Non-severe storms expected.
- Still includes lightning, heavy rain, and gusty winds.
Main Threats:
- ⚡ Frequent lightning
- 🌧️ Localized heavy rain
- 💨 Gusty winds
🟢 Marginal Risk
- Isolated severe storms possible.
- Short-lived or not widespread.
Main Threats:
- ☄️ Small hail
- 💨 Brief damaging winds
- 🌪 Low tornado risk
🟡 Slight Risk
- Scattered severe storms.
- A few may be intense.
Main Threats:
- ☄️ Large hail
- 💨 Damaging winds
- 🌪 Isolated tornadoes
🟠 Enhanced Risk
- Numerous severe storms expected.
- More persistent and organized.
Main Threats:
- ☄️ Very large hail
- 💨 Widespread damaging winds
- 🌪 A few strong tornadoes
🔴 Moderate Risk
- Widespread severe storms likely.
- Long-lived and intense.
Main Threats:
- 🌪 Strong, long-track tornadoes
- 💨 Widespread wind damage
- ☄️ Destructive hail
🟣 High Risk
- Severe weather outbreak expected.
- Most dangerous setup.
Main Threats:
- 🌪 Violent, long-track tornadoes
- 💨 Destructive straight-line winds
- ☄️ Giant hail
-

Day 1
-

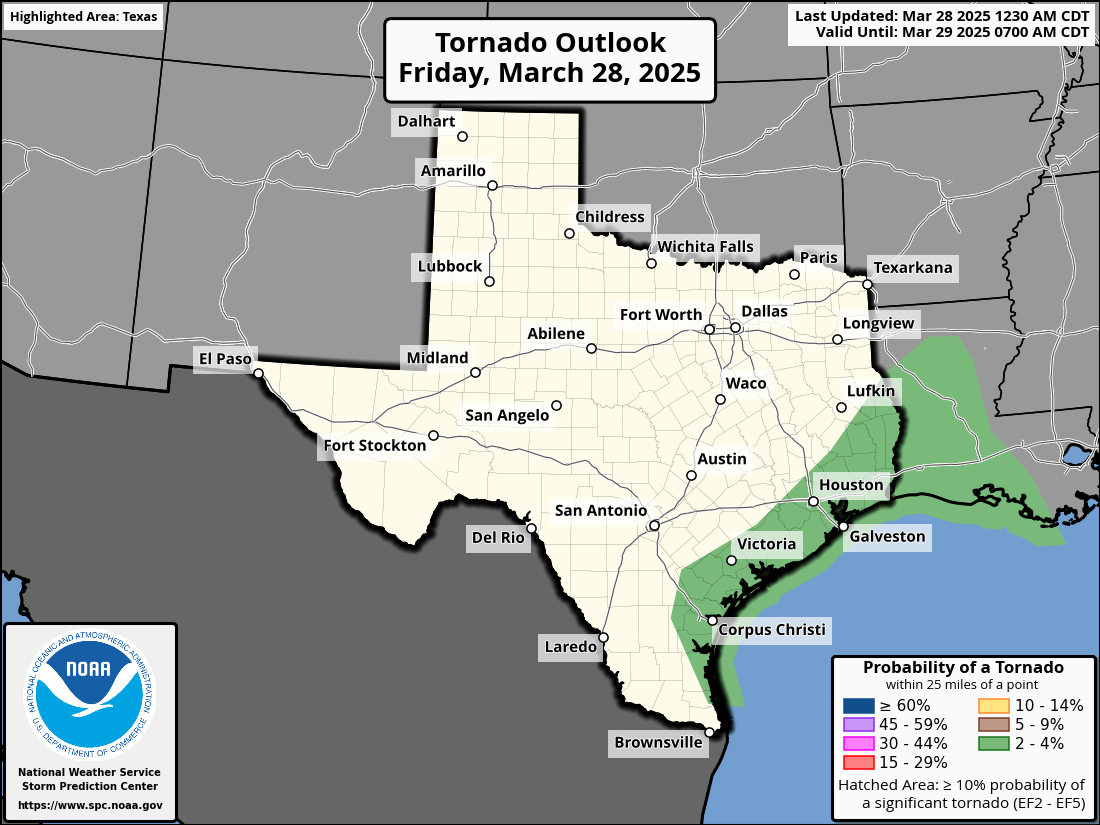
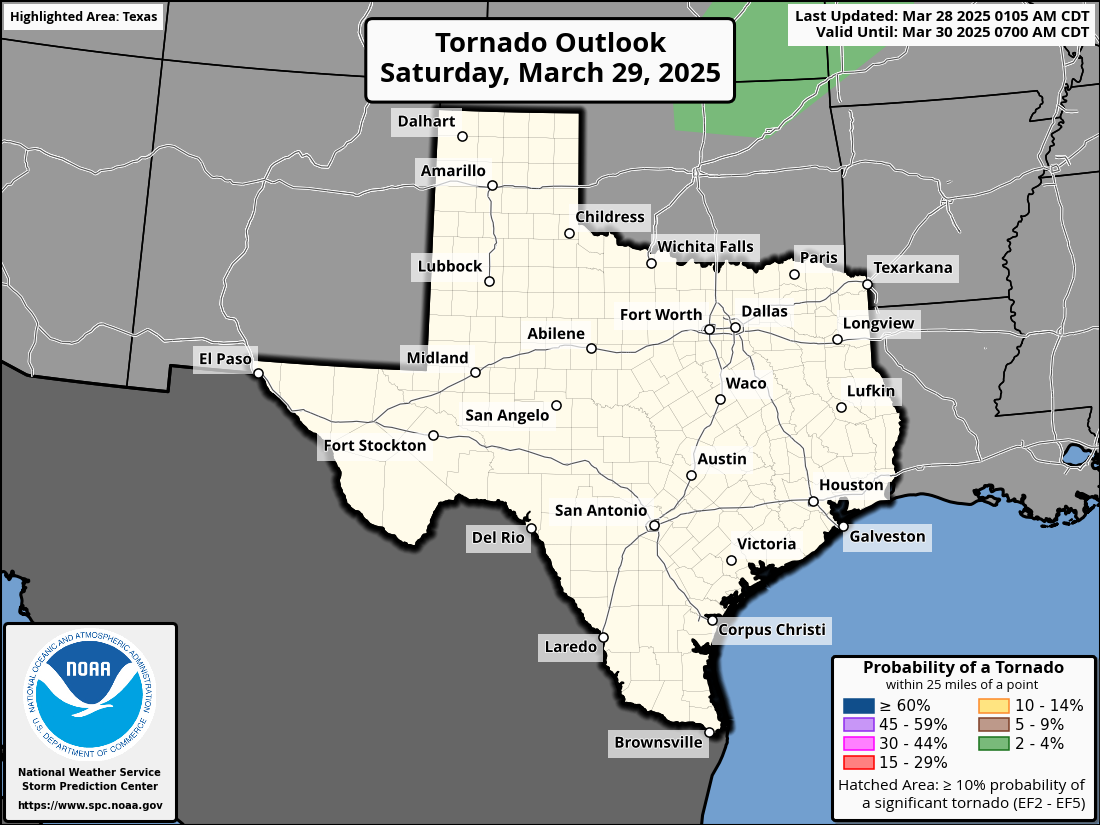
Tornado Risk
-

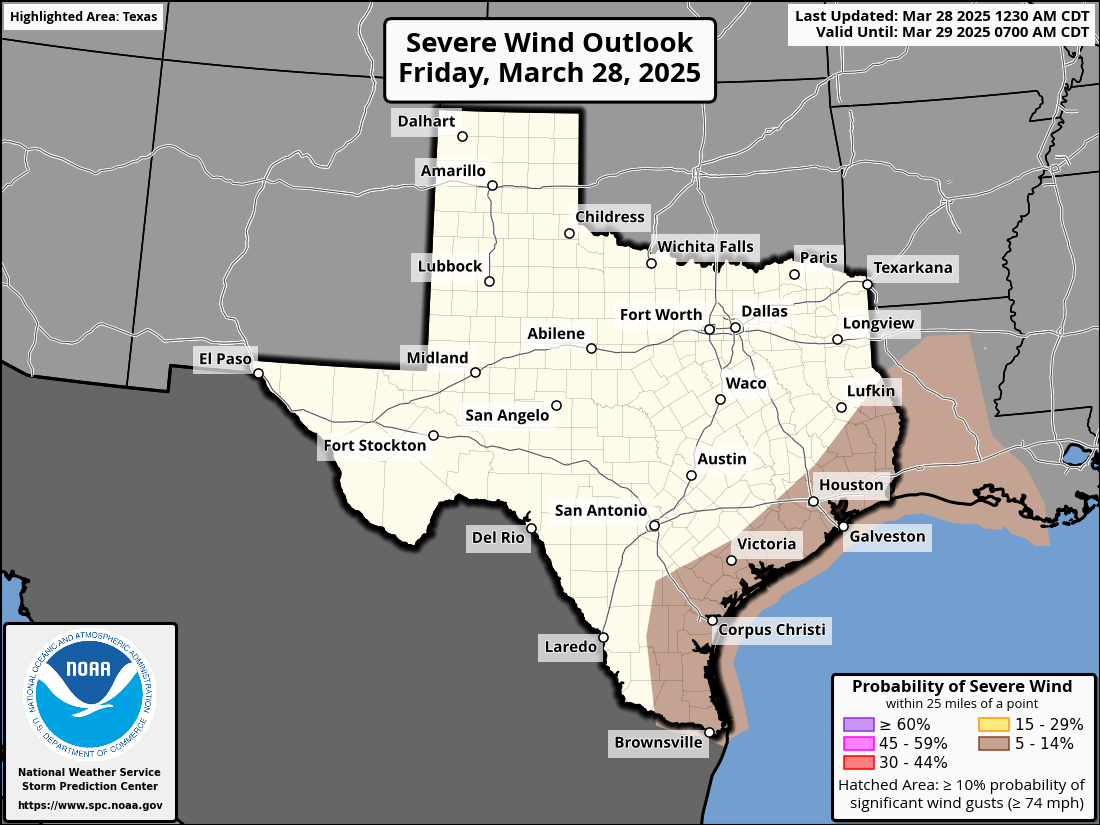
Wind Risk
-
Hail Risk

-
Day 3
-

Probability
-
Day 2
-
Tornado Risk
-
Wind Risk
-
Hail Risk
-
Day 4
-
Day 5
-
Day 6
-
Day 7
-
Day 8

Severe Weather Analysis
-
Surface Based CAPE
-
3-Hour CAPE Change
-

Supercell Composite
-

LCL Height
-
Total Totals
-
K-Index
-
Critical Angle
-
Energy-Helicity Index
-
Showalter Index
-

Significant Hail Chance
-
SARS Hail Size
-
SARS Significant Hail %
-

Significant Tornado
-

Probability of EF0+
-

Probability of EF2+
-

Probability of EF4+
Surface Based CAPE
Surface-Based CAPE, or Convective Available Potential Energy, is a term used to quantify the amount of atmospheric energy available for convective thunderstorm development near the Earth’s surface. It is a key parameter for assessing the potential for severe weather, particularly thunderstorms. Surface-Based CAPE values are expressed in joules per kilogram (J/kg), and they provide insight into the instability and likelihood of storm development. Here’s a list of number values associated with Surface-Based CAPE and their interpretations:
-
Low CAPE (0-500 J/kg):
- Limited potential for strong or severe thunderstorm development.
- Typically results in less intense convective activity.
-
Moderate CAPE (500-1,000 J/kg):
- Favorable for thunderstorms with the potential for heavy rain, lightning, and gusty winds.
- Severe weather is possible but less likely.
-
High CAPE (1,000-2,500 J/kg):
- Indicates a substantial potential for severe thunderstorms with intense updrafts.
- Increased risk of severe weather, including large hail, damaging winds, and tornadoes.
-
Very High CAPE (2,500 J/kg and above):
- Suggests an extremely unstable atmosphere, with a high potential for severe weather events, including supercells and violent thunderstorms.
3-Hour CAPE Change
3-hour CAPE change refers to the assessment of Convective Available Potential Energy (CAPE) over a three-hour time frame. CAPE is a critical meteorological parameter that quantifies the atmospheric energy available for the development of thunderstorms. A change in CAPE over a short period can indicate significant shifts in atmospheric instability, which is crucial for forecasting severe weather. Here’s a list of number values associated with 3-hour CAPE change and their implications:
-
Positive Change (in joules per kilogram, J/kg):
- A positive value indicates an increase in CAPE over the past three hours.
- Suggests growing atmospheric instability, raising the potential for thunderstorm development.
-
Negative Change (in J/kg):
- A negative value signifies a decrease in CAPE within the last three hours.
- Indicates a reduction in atmospheric instability and a potential decline in the likelihood of thunderstorms.
-
Zero Change (0 J/kg):
- A value of zero implies little to no change in CAPE during the specified time frame.
Supercell Composite
The Supercell Composite is an index designed to assess the potential for supercell thunderstorm development. Supercells are severe thunderstorms characterized by rotating updrafts, often associated with tornadoes, large hail, and damaging winds. This index combines various atmospheric parameters to gauge the likelihood of supercell formation. Here’s a list of number values associated with the Supercell Composite and their interpretations:
-
Low Value (0-1):
- Suggests a low likelihood of supercell thunderstorms.
- Typically indicates less favorable conditions for severe weather.
-
Moderate Value (1-3):
- A moderate potential for supercell development.
- Indicates the possibility of severe weather with rotating updrafts.
-
High Value (3-6):
- Suggests a significant potential for supercell thunderstorms.
- Indicates a heightened risk of severe weather events, including tornadoes.
-
Very High Value (6 and above):
- Signifies an extremely favorable environment for supercell development.
- Suggests a high risk of severe weather, often with strong and long-lived tornadoes.
LCL Height
The Lifted Condensation Level (LCL) Height is a critical parameter that helps in assessing cloud base heights and the potential for cloud formation. It represents the altitude at which a parcel of moist air, when lifted, cools to the point where its relative humidity reaches 100%, and condensation occurs, forming clouds. LCL height is vital for forecasting and understanding cloud development and weather patterns. Here’s a list of number values associated with LCL height and their implications:
-
Low LCL Height (below 1,000 meters):
- Suggests cloud formation and potential for low-level clouds.
- Often related to localized weather phenomena and cooler conditions near the surface.
-
Moderate LCL Height (1,000-2,500 meters):
- Typical for the development of mid-level clouds.
- Often associated with more stable and less convective atmospheric conditions.
-
High LCL Height (above 2,500 meters):
- Signifies cloud formation at higher altitudes.
- Indicates potential for convective storms, towering cumulus clouds, and more dynamic atmospheric conditions.
Total Totals
Total Totals (TT) is an index used to assess atmospheric instability and the potential for severe weather, especially convective storms. It is calculated by adding two temperature values and subtracting the dew point temperature. TT values help meteorologists determine the likelihood of thunderstorm development and severe weather. Here’s a list of number values associated with Total Totals and their interpretations:
-
Low TT (below 40):
- Indicates limited atmospheric instability and a lower potential for severe weather.
- Suggests a lower likelihood of intense thunderstorms.
-
Moderate TT (40-50):
- Suggests a moderate level of atmospheric instability.
- A moderate chance of thunderstorm development, potentially leading to strong storms.
-
High TT (50-55):
- Signifies a higher level of atmospheric instability.
- An increased potential for severe weather events, including strong thunderstorms.
-
Very High TT (above 55):
- Indicates an extremely unstable atmosphere with a significant potential for severe weather.
- Suggests a high likelihood of severe storms, including hail, strong winds, and possible tornadoes.
K-Index
The K-index is a valuable parameter used to evaluate atmospheric stability and the potential for thunderstorm development. It helps meteorologists assess the likelihood of severe weather and provides crucial information for weather forecasting. The K-index combines various atmospheric measurements to gauge atmospheric instability, including temperature, dew point, and wind data. Here’s a list of number values associated with the K-index and their implications:
-
Low K-index (0-15):
- Indicates a stable atmosphere with limited potential for thunderstorms.
- Suggests relatively calm and benign weather conditions.
-
Moderate K-index (15-25):
- Signifies a moderately unstable atmosphere with a moderate potential for thunderstorm development.
- Suggests a chance of scattered or non-severe thunderstorms.
-
High K-index (25-35):
- Indicates a higher level of atmospheric instability.
- Suggests an increased likelihood of severe weather, including strong thunderstorms.
-
Very High K-index (above 35):
- Signifies an extremely unstable atmosphere.
- Predicts a high likelihood of severe weather events, such as large hail, damaging winds, and tornadoes.
Critical Angle
The Critical Angle refers to the angle at which a low-level wind approaching an area of severe weather must intersect with storm motion to maximize the potential for supercell thunderstorm development and tornado formation. This concept is essential for understanding atmospheric conditions conducive to severe weather and tornadoes. Here’s a list of number values associated with the Critical Angle and their implications:
-
Small Critical Angle (0-30 degrees):
- A small angle suggests that low-level winds are nearly aligned with the storm’s motion.
- This configuration can enhance the potential for supercell thunderstorms and increase the risk of tornadoes.
-
Moderate Critical Angle (30-60 degrees):
- A moderate angle indicates that low-level winds approach the storm at an angle.
- This scenario offers a reasonable chance for supercell development and tornadoes but may not be as conducive as a smaller critical angle.
-
Large Critical Angle (60-90 degrees):
- A large critical angle suggests that low-level winds intersect the storm’s motion at a significant angle.
- This configuration is less favorable for supercell and tornado development.
Energy-Helicity Index
The Energy-Helicity Index (EHI) is a meteorological parameter that combines measures of both convective available potential energy (CAPE) and helicity. It is used to assess the potential for supercell thunderstorm development and tornado formation. The EHI provides valuable insights into the atmospheric conditions conducive to severe weather events. Here’s a list of number values associated with the Energy-Helicity Index and their interpretations:
-
Low EHI (0-1):
- Suggests a minimal potential for supercell thunderstorms and tornadoes.
- Typically indicates less favorable conditions for severe weather.
-
Moderate EHI (1-5):
- Signifies a moderate potential for supercell development and tornadoes.
- Suggests the possibility of severe weather events.
-
High EHI (5-10):
- Indicates a significant potential for supercell thunderstorms and tornadoes.
- Suggests a heightened risk of severe weather, including the formation of strong tornadoes.
-
Very High EHI (10 and above):
- Signifies an extremely favorable environment for supercell development and severe weather.
- Suggests a high risk of severe weather events, with the potential for violent, long-lived tornadoes.
Showalter Index
The Showalter Index is a parameter that measures the potential for atmospheric instability, specifically focusing on the presence of elevated convection within the atmosphere. It is often used to assess the likelihood of thunderstorm development and severe weather. The Showalter Index takes into account the temperature of a parcel of air lifted to a particular pressure level and compares it to the surrounding air’s temperature at that level. Here’s a list of number values associated with the Showalter Index and their implications:
-
Positive Showalter Index (+1 to +3):
- Suggests a relatively stable atmosphere with limited potential for thunderstorm development.
- Typically indicative of favorable weather conditions.
-
Near Zero Showalter Index (-1 to +1):
- Indicates a marginally unstable atmosphere with a low potential for thunderstorms.
- May lead to isolated or less severe convective activity.
-
Negative Showalter Index (-1 to -3):
- Suggests an unstable atmosphere with a reasonable potential for thunderstorm development.
- May lead to more widespread and potentially severe thunderstorms.
-
Strongly Negative Showalter Index (below -3):
- Signifies a highly unstable atmosphere with a significant potential for severe weather, including strong thunderstorms and severe hail.
Significant Hail Chance
The Significant Hail Chance (SHC) is a parameter used to assess the likelihood of significant hail formation in a given area. Hail is a type of severe weather event that can cause substantial damage to crops, vehicles, buildings, and pose a threat to human safety. The SHC provides valuable information to meteorologists and the public to prepare for such events. Here’s a list of number values associated with the Significant Hail Chance and their implications:
-
Low SHC (0-10%):
- Suggests a low likelihood of significant hail formation.
- Typically associated with benign or non-severe weather conditions.
-
Moderate SHC (10-30%):
- Indicates a moderate potential for significant hail.
- May lead to sporadic hail events, but they are not expected to be widespread or severe.
-
High SHC (30-50%):
- Signifies a substantial likelihood of significant hail.
- Implies a heightened risk of hailstorms, which can lead to local damage.
-
Very High SHC (above 50%):
- Indicates an extremely favorable environment for significant hail.
- Suggests a high risk of severe hail events, with the potential for large hailstones that can cause extensive damage.
SARS Hail Size
SARS Hail Size (Supercell Composite Reflectivity of the Maximum Expected Hail Size) is a parameter used to predict the size of hail that may occur within a severe thunderstorm. Hailstorms can be particularly destructive, causing damage to crops, vehicles, and structures. The SARS Hail Size parameter helps meteorologists and the public anticipate the potential impact of hail within a given storm. Here’s a list of number values associated with SARS Hail Size and their implications:
-
Small Hail (less than 1 inch or 2.5 cm):
- SARS Hail Size values at the lower end suggest the likelihood of small hail.
- Typically results in minimal property damage and a low risk to public safety.
-
Moderate Hail (1-1.5 inches or 2.5-3.8 cm):
- SARS Hail Size values in this range indicate the potential for moderate-sized hailstones.
- May cause some damage to vehicles and minor property damage.
-
Large Hail (1.5-2 inches or 3.8-5 cm):
- Suggests the likelihood of large hail that can cause significant damage to vehicles and property.
- May pose a risk to public safety.
-
Very Large Hail (2 inches or more or 5 cm and above):
- SARS Hail Size values at the upper end indicate the potential for very large hailstones.
- These hailstones can cause extensive damage, pose a severe risk to public safety, and result in significant financial losses.
SARS Significant Hail %
The SARS Significant Hail Chance (Supercell Composite Reflectivity Significant Hail Chance) is a parameter used to estimate the likelihood of significant hail occurring within a severe thunderstorm. Hail can cause extensive damage to property, crops, and pose risks to human safety. The SARS Significant Hail Chance parameter helps meteorologists and the public prepare for and respond to hailstorms. Here’s a list of number values associated with the SARS Significant Hail Chance and their interpretations:
-
Low Significant Hail Chance (0-10%):
- Suggests a low probability of significant hail formation.
- Typically associated with benign or non-severe weather conditions.
-
Moderate Significant Hail Chance (10-30%):
- Indicates a moderate potential for significant hail.
- May result in sporadic hail events but not expected to be widespread or particularly severe.
-
High Significant Hail Chance (30-50%):
- Signifies a substantial likelihood of significant hail.
- Implies an increased risk of hailstorms, which can lead to local damage.
-
Very High Significant Hail Chance (above 50%):
- Indicates an extremely favorable environment for significant hail.
- Suggests a high risk of severe hail events with the potential for large, damaging hailstones.
Significant Tornado
The Significant Tornado parameter, often referred to as SigTornado, is an index used to assess the potential for significant and violent tornadoes within a severe thunderstorm or supercell. Tornadoes are among the most destructive and life-threatening weather phenomena, and predicting their severity is crucial for public safety and preparedness. Here’s a list of number values associated with the Significant Tornado parameter and their interpretations:
-
Low SigTornado (0-1):
- Suggests a low likelihood of significant tornado development.
- Typically indicative of benign or non-severe weather conditions.
-
Moderate SigTornado (1-3):
- Indicates a moderate potential for significant tornadoes.
- Suggests a chance of isolated or non-severe tornado events.
-
High SigTornado (3-6):
- Signifies a substantial likelihood of significant tornado development.
- Implies an increased risk of tornadoes, including potentially strong ones.
-
Very High SigTornado (above 6):
- Indicates an extremely favorable environment for significant and violent tornadoes.
- Suggests a high risk of severe tornado events, including long-lived and violent ones.
Probability of EF0+
The Probability of EF-0 Tornado is a meteorological parameter used to estimate the likelihood of a tornado occurring at the EF-0 intensity level on the Enhanced Fujita (EF) scale. EF-0 tornadoes are the weakest on the scale, with wind speeds between 65 and 85 miles per hour (105-137 km/h). While they are less destructive than stronger tornadoes, EF-0 tornadoes can still cause damage to buildings and vegetation. Here’s a list of number values associated with the Probability of EF-0 Tornado and their implications:
-
Low Probability (0-10%):
- Suggests a low chance of an EF-0 tornado occurring.
- Typically indicative of non-severe or benign weather conditions.
-
Moderate Probability (10-30%):
- Indicates a moderate chance of an EF-0 tornado.
- Suggests the potential for isolated EF-0 tornadoes within a given area.
-
High Probability (30-50%):
- Signifies a substantial likelihood of EF-0 tornado development.
- Implies an increased risk of EF-0 tornadoes, often associated with severe weather events.
-
Very High Probability (above 50%):
- Indicates an extremely favorable environment for EF-0 tornadoes.
- Suggests a high risk of EF-0 tornadoes, often associated with more significant severe weather outbreaks.
Probability of EF2+

The Probability of EF-2 Tornado is a meteorological parameter used to estimate the likelihood of a tornado occurring at the EF-2 intensity level on the Enhanced Fujita (EF) scale. EF-2 tornadoes are characterized by wind speeds between 111 and 135 miles per hour (179-217 km/h) and can cause significant damage to buildings and vegetation. Here’s a list of number values associated with the Probability of EF-2 Tornado and their implications:
-
Low Probability (0-10%):
- Suggests a low chance of an EF-2 tornado occurring.
- Typically indicative of non-severe or benign weather conditions.
-
Moderate Probability (10-30%):
- Indicates a moderate chance of an EF-2 tornado.
- Suggests the potential for isolated EF-2 tornadoes within a given area.
-
High Probability (30-50%):
- Signifies a substantial likelihood of EF-2 tornado development.
- Implies an increased risk of EF-2 tornadoes, often associated with severe weather events.
-
Very High Probability (above 50%):
- Indicates an extremely favorable environment for EF-2 tornadoes.
- Suggests a high risk of EF-2 tornadoes, often associated with more significant severe weather outbreaks.
Probability of EF4+
The Probability of EF-4 Tornado is a meteorological parameter used to assess the likelihood of a tornado occurring at the EF-4 intensity level on the Enhanced Fujita (EF) scale. EF-4 tornadoes are characterized by violent wind speeds ranging from 166 to 200 miles per hour (267-322 km/h). These tornadoes can cause extensive damage to buildings and landscapes and pose a significant threat to life and safety. Here’s a list of number values associated with the Probability of EF-4 Tornado and their implications:
-
Low Probability (0-10%):
- Suggests a low chance of an EF-4 tornado occurring.
- Typically indicative of non-severe or benign weather conditions.
-
Moderate Probability (10-30%):
- Indicates a moderate chance of an EF-4 tornado.
- Suggests the potential for isolated EF-4 tornadoes within a given area.
-
High Probability (30-50%):
- Signifies a substantial likelihood of EF-4 tornado development.
- Implies an increased risk of EF-4 tornadoes, often associated with severe weather events.
-
Very High Probability (above 50%):
- Indicates an extremely favorable environment for EF-4 tornadoes.
- Suggests a high risk of EF-4 tornadoes, often linked to significant and severe weather outbreaks.
Surface Based CAPE
Surface-Based CAPE, or Convective Available Potential Energy, is a term used to quantify the amount of atmospheric energy available for convective thunderstorm development near the Earth’s surface. It is a key parameter for assessing the potential for severe weather, particularly thunderstorms. Surface-Based CAPE values are expressed in joules per kilogram (J/kg), and they provide insight into the instability and likelihood of storm development. Here’s a list of number values associated with Surface-Based CAPE and their interpretations:
-
Low CAPE (0-500 J/kg):
- Limited potential for strong or severe thunderstorm development.
- Typically results in less intense convective activity.
-
Moderate CAPE (500-1,000 J/kg):
- Favorable for thunderstorms with the potential for heavy rain, lightning, and gusty winds.
- Severe weather is possible but less likely.
-
High CAPE (1,000-2,500 J/kg):
- Indicates a substantial potential for severe thunderstorms with intense updrafts.
- Increased risk of severe weather, including large hail, damaging winds, and tornadoes.
-
Very High CAPE (2,500 J/kg and above):
- Suggests an extremely unstable atmosphere, with a high potential for severe weather events, including supercells and violent thunderstorms.
3-Hour CAPE Change
3-hour CAPE change refers to the assessment of Convective Available Potential Energy (CAPE) over a three-hour time frame. CAPE is a critical meteorological parameter that quantifies the atmospheric energy available for the development of thunderstorms. A change in CAPE over a short period can indicate significant shifts in atmospheric instability, which is crucial for forecasting severe weather. Here’s a list of number values associated with 3-hour CAPE change and their implications:
-
Positive Change (in joules per kilogram, J/kg):
- A positive value indicates an increase in CAPE over the past three hours.
- Suggests growing atmospheric instability, raising the potential for thunderstorm development.
-
Negative Change (in J/kg):
- A negative value signifies a decrease in CAPE within the last three hours.
- Indicates a reduction in atmospheric instability and a potential decline in the likelihood of thunderstorms.
-
Zero Change (0 J/kg):
- A value of zero implies little to no change in CAPE during the specified time frame.
Supercell Composite
The Supercell Composite is an index designed to assess the potential for supercell thunderstorm development. Supercells are severe thunderstorms characterized by rotating updrafts, often associated with tornadoes, large hail, and damaging winds. This index combines various atmospheric parameters to gauge the likelihood of supercell formation. Here’s a list of number values associated with the Supercell Composite and their interpretations:
-
Low Value (0-1):
- Suggests a low likelihood of supercell thunderstorms.
- Typically indicates less favorable conditions for severe weather.
-
Moderate Value (1-3):
- A moderate potential for supercell development.
- Indicates the possibility of severe weather with rotating updrafts.
-
High Value (3-6):
- Suggests a significant potential for supercell thunderstorms.
- Indicates a heightened risk of severe weather events, including tornadoes.
-
Very High Value (6 and above):
- Signifies an extremely favorable environment for supercell development.
- Suggests a high risk of severe weather, often with strong and long-lived tornadoes.
LCL Height
The Lifted Condensation Level (LCL) Height is a critical parameter that helps in assessing cloud base heights and the potential for cloud formation. It represents the altitude at which a parcel of moist air, when lifted, cools to the point where its relative humidity reaches 100%, and condensation occurs, forming clouds. LCL height is vital for forecasting and understanding cloud development and weather patterns. Here’s a list of number values associated with LCL height and their implications:
-
Low LCL Height (below 1,000 meters):
- Suggests cloud formation and potential for low-level clouds.
- Often related to localized weather phenomena and cooler conditions near the surface.
-
Moderate LCL Height (1,000-2,500 meters):
- Typical for the development of mid-level clouds.
- Often associated with more stable and less convective atmospheric conditions.
-
High LCL Height (above 2,500 meters):
- Signifies cloud formation at higher altitudes.
- Indicates potential for convective storms, towering cumulus clouds, and more dynamic atmospheric conditions.
Total Totals
Total Totals (TT) is an index used to assess atmospheric instability and the potential for severe weather, especially convective storms. It is calculated by adding two temperature values and subtracting the dew point temperature. TT values help meteorologists determine the likelihood of thunderstorm development and severe weather. Here’s a list of number values associated with Total Totals and their interpretations:
-
Low TT (below 40):
- Indicates limited atmospheric instability and a lower potential for severe weather.
- Suggests a lower likelihood of intense thunderstorms.
-
Moderate TT (40-50):
- Suggests a moderate level of atmospheric instability.
- A moderate chance of thunderstorm development, potentially leading to strong storms.
-
High TT (50-55):
- Signifies a higher level of atmospheric instability.
- An increased potential for severe weather events, including strong thunderstorms.
-
Very High TT (above 55):
- Indicates an extremely unstable atmosphere with a significant potential for severe weather.
- Suggests a high likelihood of severe storms, including hail, strong winds, and possible tornadoes.
K-Index
The K-index is a valuable parameter used to evaluate atmospheric stability and the potential for thunderstorm development. It helps meteorologists assess the likelihood of severe weather and provides crucial information for weather forecasting. The K-index combines various atmospheric measurements to gauge atmospheric instability, including temperature, dew point, and wind data. Here’s a list of number values associated with the K-index and their implications:
-
Low K-index (0-15):
- Indicates a stable atmosphere with limited potential for thunderstorms.
- Suggests relatively calm and benign weather conditions.
-
Moderate K-index (15-25):
- Signifies a moderately unstable atmosphere with a moderate potential for thunderstorm development.
- Suggests a chance of scattered or non-severe thunderstorms.
-
High K-index (25-35):
- Indicates a higher level of atmospheric instability.
- Suggests an increased likelihood of severe weather, including strong thunderstorms.
-
Very High K-index (above 35):
- Signifies an extremely unstable atmosphere.
- Predicts a high likelihood of severe weather events, such as large hail, damaging winds, and tornadoes.
Critical Angle
The Critical Angle refers to the angle at which a low-level wind approaching an area of severe weather must intersect with storm motion to maximize the potential for supercell thunderstorm development and tornado formation. This concept is essential for understanding atmospheric conditions conducive to severe weather and tornadoes. Here’s a list of number values associated with the Critical Angle and their implications:
-
Small Critical Angle (0-30 degrees):
- A small angle suggests that low-level winds are nearly aligned with the storm’s motion.
- This configuration can enhance the potential for supercell thunderstorms and increase the risk of tornadoes.
-
Moderate Critical Angle (30-60 degrees):
- A moderate angle indicates that low-level winds approach the storm at an angle.
- This scenario offers a reasonable chance for supercell development and tornadoes but may not be as conducive as a smaller critical angle.
-
Large Critical Angle (60-90 degrees):
- A large critical angle suggests that low-level winds intersect the storm’s motion at a significant angle.
- This configuration is less favorable for supercell and tornado development.
Energy-Helicity Index
The Energy-Helicity Index (EHI) is a meteorological parameter that combines measures of both convective available potential energy (CAPE) and helicity. It is used to assess the potential for supercell thunderstorm development and tornado formation. The EHI provides valuable insights into the atmospheric conditions conducive to severe weather events. Here’s a list of number values associated with the Energy-Helicity Index and their interpretations:
-
Low EHI (0-1):
- Suggests a minimal potential for supercell thunderstorms and tornadoes.
- Typically indicates less favorable conditions for severe weather.
-
Moderate EHI (1-5):
- Signifies a moderate potential for supercell development and tornadoes.
- Suggests the possibility of severe weather events.
-
High EHI (5-10):
- Indicates a significant potential for supercell thunderstorms and tornadoes.
- Suggests a heightened risk of severe weather, including the formation of strong tornadoes.
-
Very High EHI (10 and above):
- Signifies an extremely favorable environment for supercell development and severe weather.
- Suggests a high risk of severe weather events, with the potential for violent, long-lived tornadoes.
Showalter Index
The Showalter Index is a parameter that measures the potential for atmospheric instability, specifically focusing on the presence of elevated convection within the atmosphere. It is often used to assess the likelihood of thunderstorm development and severe weather. The Showalter Index takes into account the temperature of a parcel of air lifted to a particular pressure level and compares it to the surrounding air’s temperature at that level. Here’s a list of number values associated with the Showalter Index and their implications:
-
Positive Showalter Index (+1 to +3):
- Suggests a relatively stable atmosphere with limited potential for thunderstorm development.
- Typically indicative of favorable weather conditions.
-
Near Zero Showalter Index (-1 to +1):
- Indicates a marginally unstable atmosphere with a low potential for thunderstorms.
- May lead to isolated or less severe convective activity.
-
Negative Showalter Index (-1 to -3):
- Suggests an unstable atmosphere with a reasonable potential for thunderstorm development.
- May lead to more widespread and potentially severe thunderstorms.
-
Strongly Negative Showalter Index (below -3):
- Signifies a highly unstable atmosphere with a significant potential for severe weather, including strong thunderstorms and severe hail.
Significant Hail Chance
The Significant Hail Chance (SHC) is a parameter used to assess the likelihood of significant hail formation in a given area. Hail is a type of severe weather event that can cause substantial damage to crops, vehicles, buildings, and pose a threat to human safety. The SHC provides valuable information to meteorologists and the public to prepare for such events. Here’s a list of number values associated with the Significant Hail Chance and their implications:
-
Low SHC (0-10%):
- Suggests a low likelihood of significant hail formation.
- Typically associated with benign or non-severe weather conditions.
-
Moderate SHC (10-30%):
- Indicates a moderate potential for significant hail.
- May lead to sporadic hail events, but they are not expected to be widespread or severe.
-
High SHC (30-50%):
- Signifies a substantial likelihood of significant hail.
- Implies a heightened risk of hailstorms, which can lead to local damage.
-
Very High SHC (above 50%):
- Indicates an extremely favorable environment for significant hail.
- Suggests a high risk of severe hail events, with the potential for large hailstones that can cause extensive damage.
SARS Hail Size
SARS Hail Size (Supercell Composite Reflectivity of the Maximum Expected Hail Size) is a parameter used to predict the size of hail that may occur within a severe thunderstorm. Hailstorms can be particularly destructive, causing damage to crops, vehicles, and structures. The SARS Hail Size parameter helps meteorologists and the public anticipate the potential impact of hail within a given storm. Here’s a list of number values associated with SARS Hail Size and their implications:
-
Small Hail (less than 1 inch or 2.5 cm):
- SARS Hail Size values at the lower end suggest the likelihood of small hail.
- Typically results in minimal property damage and a low risk to public safety.
-
Moderate Hail (1-1.5 inches or 2.5-3.8 cm):
- SARS Hail Size values in this range indicate the potential for moderate-sized hailstones.
- May cause some damage to vehicles and minor property damage.
-
Large Hail (1.5-2 inches or 3.8-5 cm):
- Suggests the likelihood of large hail that can cause significant damage to vehicles and property.
- May pose a risk to public safety.
-
Very Large Hail (2 inches or more or 5 cm and above):
- SARS Hail Size values at the upper end indicate the potential for very large hailstones.
- These hailstones can cause extensive damage, pose a severe risk to public safety, and result in significant financial losses.
SARS Significant Hail %
The SARS Significant Hail Chance (Supercell Composite Reflectivity Significant Hail Chance) is a parameter used to estimate the likelihood of significant hail occurring within a severe thunderstorm. Hail can cause extensive damage to property, crops, and pose risks to human safety. The SARS Significant Hail Chance parameter helps meteorologists and the public prepare for and respond to hailstorms. Here’s a list of number values associated with the SARS Significant Hail Chance and their interpretations:
-
Low Significant Hail Chance (0-10%):
- Suggests a low probability of significant hail formation.
- Typically associated with benign or non-severe weather conditions.
-
Moderate Significant Hail Chance (10-30%):
- Indicates a moderate potential for significant hail.
- May result in sporadic hail events but not expected to be widespread or particularly severe.
-
High Significant Hail Chance (30-50%):
- Signifies a substantial likelihood of significant hail.
- Implies an increased risk of hailstorms, which can lead to local damage.
-
Very High Significant Hail Chance (above 50%):
- Indicates an extremely favorable environment for significant hail.
- Suggests a high risk of severe hail events with the potential for large, damaging hailstones.
Significant Tornado
The Significant Tornado parameter, often referred to as SigTornado, is an index used to assess the potential for significant and violent tornadoes within a severe thunderstorm or supercell. Tornadoes are among the most destructive and life-threatening weather phenomena, and predicting their severity is crucial for public safety and preparedness. Here’s a list of number values associated with the Significant Tornado parameter and their interpretations:
-
Low SigTornado (0-1):
- Suggests a low likelihood of significant tornado development.
- Typically indicative of benign or non-severe weather conditions.
-
Moderate SigTornado (1-3):
- Indicates a moderate potential for significant tornadoes.
- Suggests a chance of isolated or non-severe tornado events.
-
High SigTornado (3-6):
- Signifies a substantial likelihood of significant tornado development.
- Implies an increased risk of tornadoes, including potentially strong ones.
-
Very High SigTornado (above 6):
- Indicates an extremely favorable environment for significant and violent tornadoes.
- Suggests a high risk of severe tornado events, including long-lived and violent ones.
Probability of EF0+
The Probability of EF-0 Tornado is a meteorological parameter used to estimate the likelihood of a tornado occurring at the EF-0 intensity level on the Enhanced Fujita (EF) scale. EF-0 tornadoes are the weakest on the scale, with wind speeds between 65 and 85 miles per hour (105-137 km/h). While they are less destructive than stronger tornadoes, EF-0 tornadoes can still cause damage to buildings and vegetation. Here’s a list of number values associated with the Probability of EF-0 Tornado and their implications:
-
Low Probability (0-10%):
- Suggests a low chance of an EF-0 tornado occurring.
- Typically indicative of non-severe or benign weather conditions.
-
Moderate Probability (10-30%):
- Indicates a moderate chance of an EF-0 tornado.
- Suggests the potential for isolated EF-0 tornadoes within a given area.
-
High Probability (30-50%):
- Signifies a substantial likelihood of EF-0 tornado development.
- Implies an increased risk of EF-0 tornadoes, often associated with severe weather events.
-
Very High Probability (above 50%):
- Indicates an extremely favorable environment for EF-0 tornadoes.
- Suggests a high risk of EF-0 tornadoes, often associated with more significant severe weather outbreaks.
Probability of EF2+
The Probability of EF-2 Tornado is a meteorological parameter used to estimate the likelihood of a tornado occurring at the EF-2 intensity level on the Enhanced Fujita (EF) scale. EF-2 tornadoes are characterized by wind speeds between 111 and 135 miles per hour (179-217 km/h) and can cause significant damage to buildings and vegetation. Here’s a list of number values associated with the Probability of EF-2 Tornado and their implications:
-
Low Probability (0-10%):
- Suggests a low chance of an EF-2 tornado occurring.
- Typically indicative of non-severe or benign weather conditions.
-
Moderate Probability (10-30%):
- Indicates a moderate chance of an EF-2 tornado.
- Suggests the potential for isolated EF-2 tornadoes within a given area.
-
High Probability (30-50%):
- Signifies a substantial likelihood of EF-2 tornado development.
- Implies an increased risk of EF-2 tornadoes, often associated with severe weather events.
-
Very High Probability (above 50%):
- Indicates an extremely favorable environment for EF-2 tornadoes.
- Suggests a high risk of EF-2 tornadoes, often associated with more significant severe weather outbreaks.
Probability of EF4+
The Probability of EF-4 Tornado is a meteorological parameter used to assess the likelihood of a tornado occurring at the EF-4 intensity level on the Enhanced Fujita (EF) scale. EF-4 tornadoes are characterized by violent wind speeds ranging from 166 to 200 miles per hour (267-322 km/h). These tornadoes can cause extensive damage to buildings and landscapes and pose a significant threat to life and safety. Here’s a list of number values associated with the Probability of EF-4 Tornado and their implications:
-
Low Probability (0-10%):
- Suggests a low chance of an EF-4 tornado occurring.
- Typically indicative of non-severe or benign weather conditions.
-
Moderate Probability (10-30%):
- Indicates a moderate chance of an EF-4 tornado.
- Suggests the potential for isolated EF-4 tornadoes within a given area.
-
High Probability (30-50%):
- Signifies a substantial likelihood of EF-4 tornado development.
- Implies an increased risk of EF-4 tornadoes, often associated with severe weather events.
-
Very High Probability (above 50%):
- Indicates an extremely favorable environment for EF-4 tornadoes.
- Suggests a high risk of EF-4 tornadoes, often linked to significant and severe weather outbreaks.