| Winter Weather Center
Winter Weather Center is a compact yet informative page filled with a few different types of useful weather models for Winter Weather Forecasting!
72-Hour Probability of Snow Accumulating
Day 3-7 U.S. Hazards Outlook

Day 8-14 U.S. Hazards Outlook


Short-Range Climate Outlook


Precipitation Outlook / Forecast Maps
Day 1

Day 2

Day 3
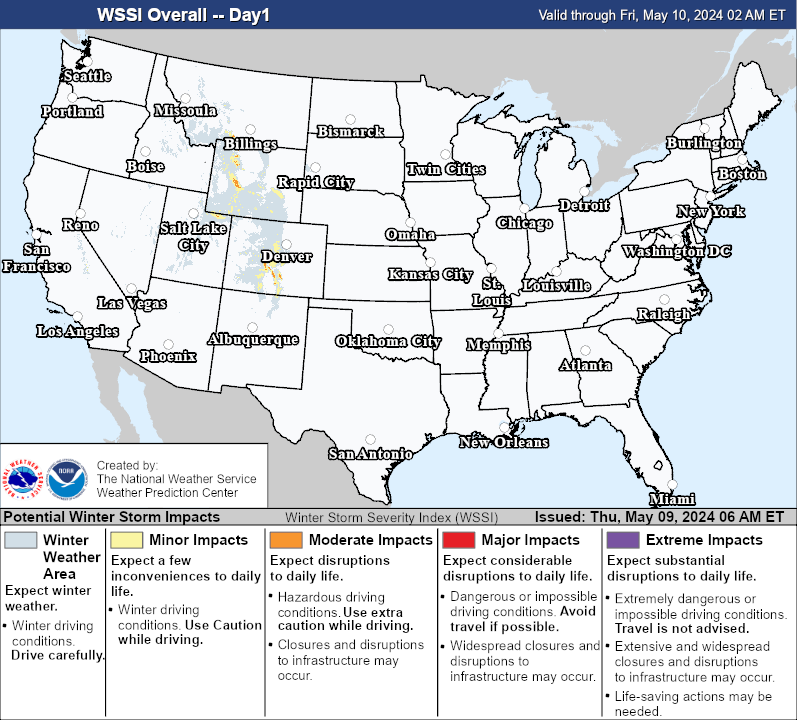
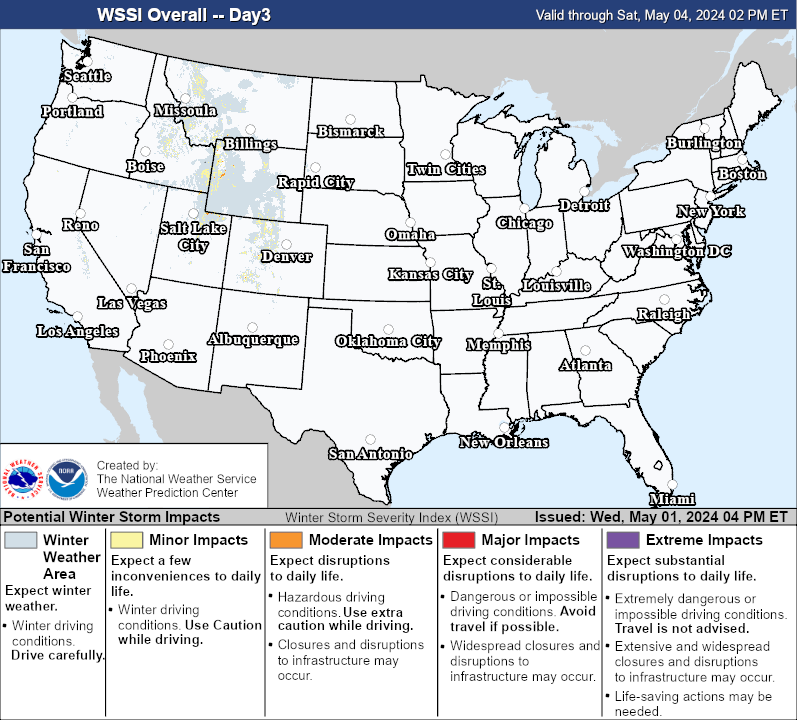
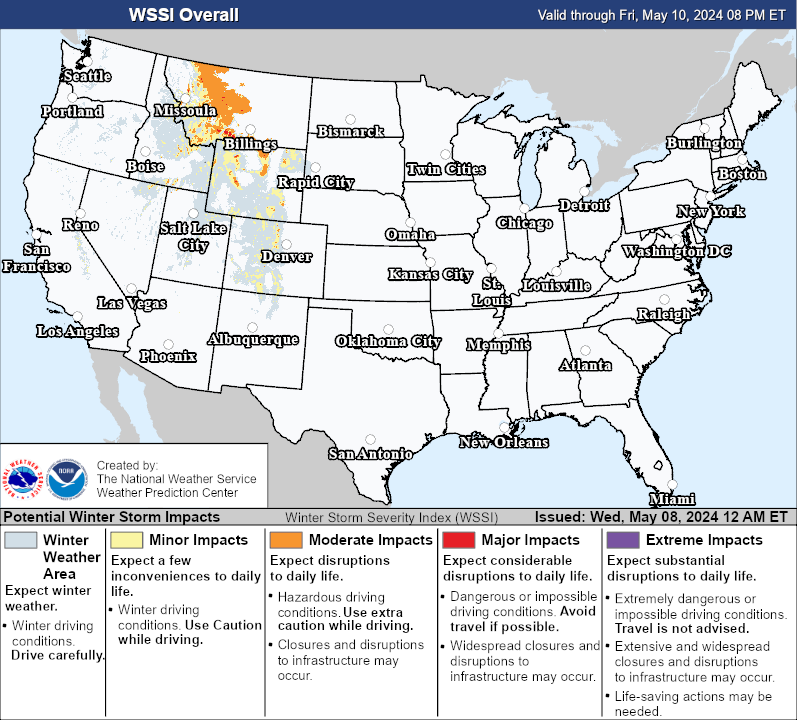
Winter Storm Severity Index (WSSI)
This chart is a useful chart giving the probable impact levels for specific area. Follow the color-coded legend at the bottom to determine what the overall risk is. This chart uses information like snow amount, snow load, ice accumulation, freezing temperatures, blowing snow, and blizzard condition chances to calculate the overall risk.