| North Texas Weather Data
Climate Forecasts, severe weather analysis data, weather trends, and current conditions are all found here!
Current Forecast
Current Weather Conditions
6 Day Weather Forecast
Pollen Counts
Fire Weather Danger
| Satellite Imagery
See the latest Satellite Imagery of the southern plains, the US, and the whole disk! See various types of imagery like infrared, water vapor, visible, and more!
| Hurricane Tracking
See the latest Hurricane Outlooks, track hurricanes with an interactive map, and see the latest satellite imagery of the hurricanes!
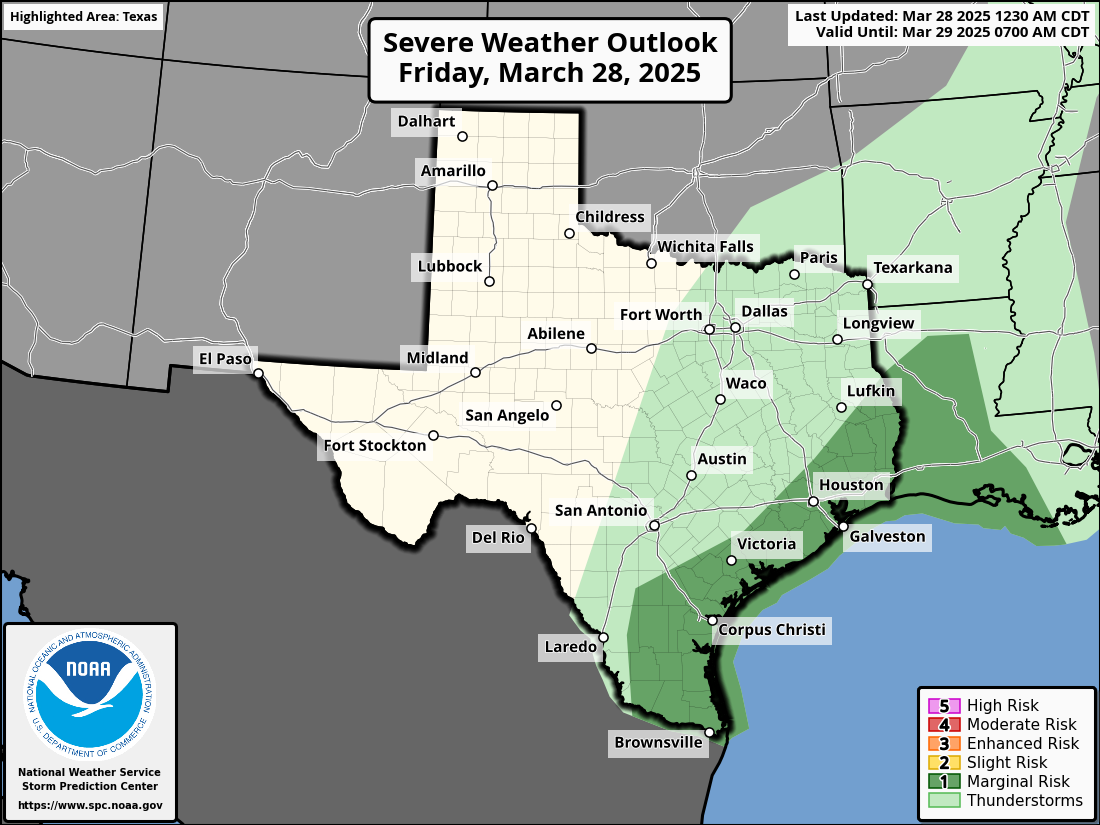
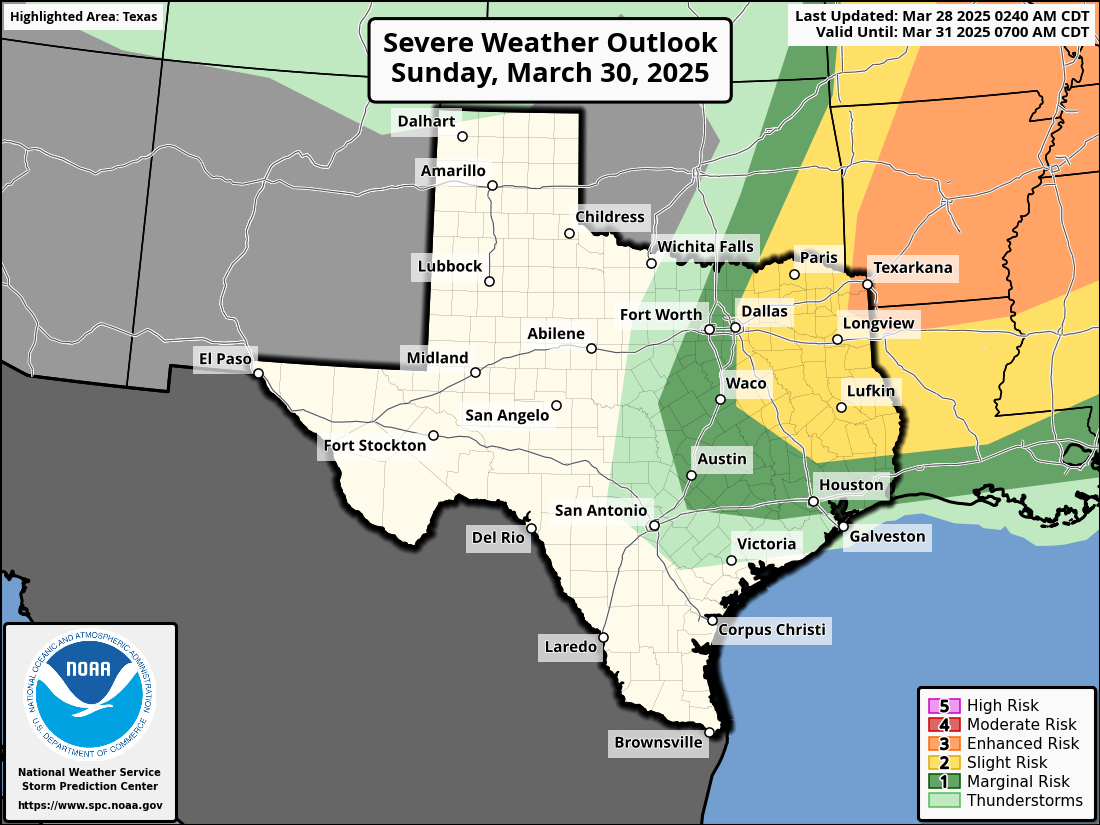
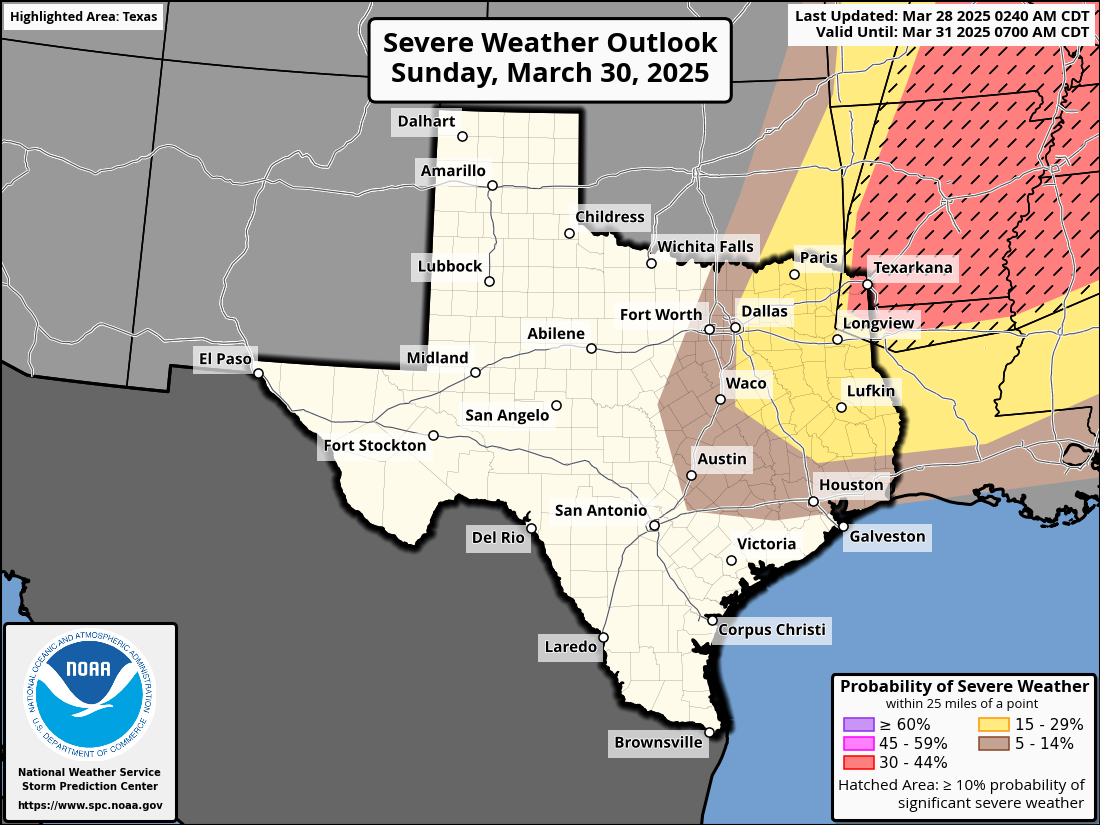
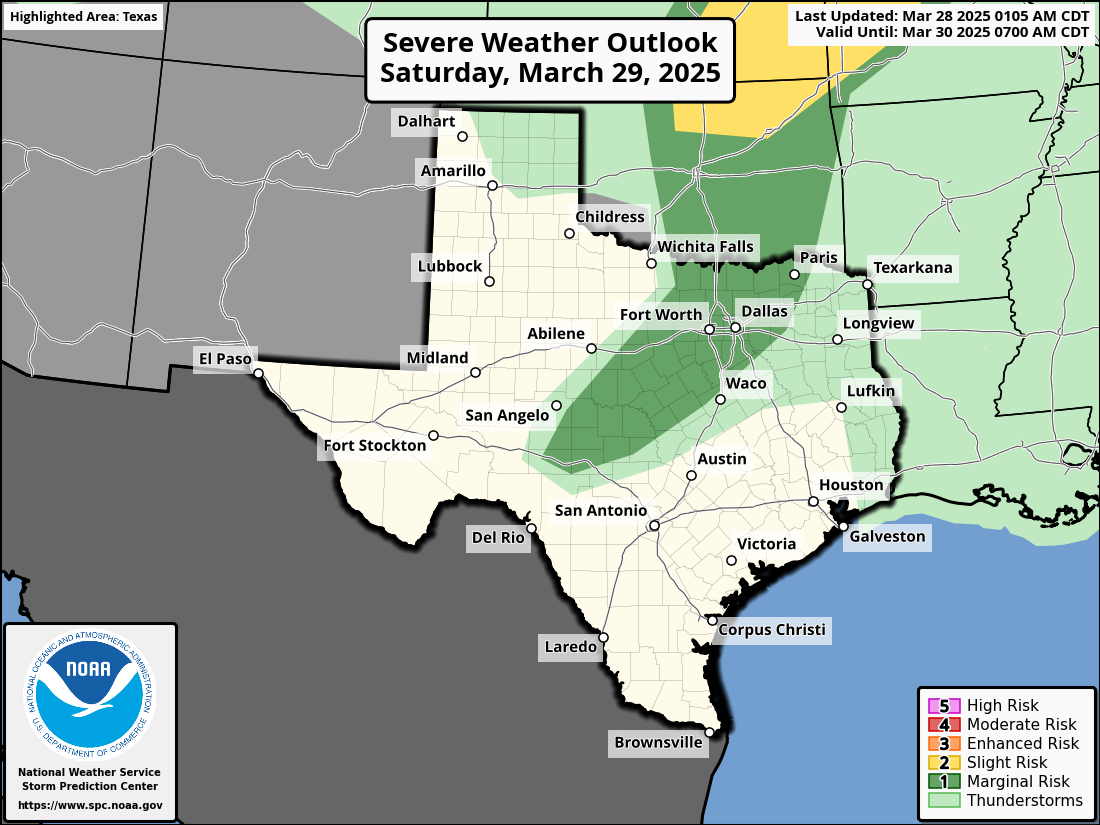
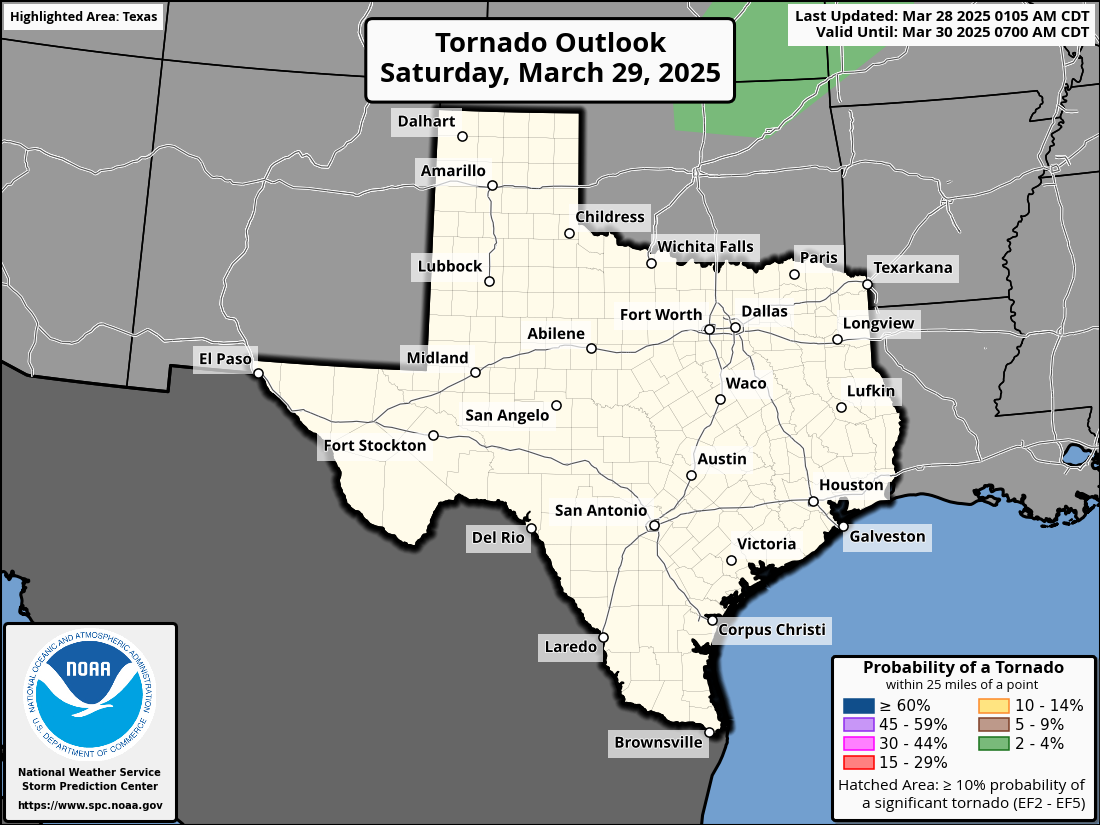
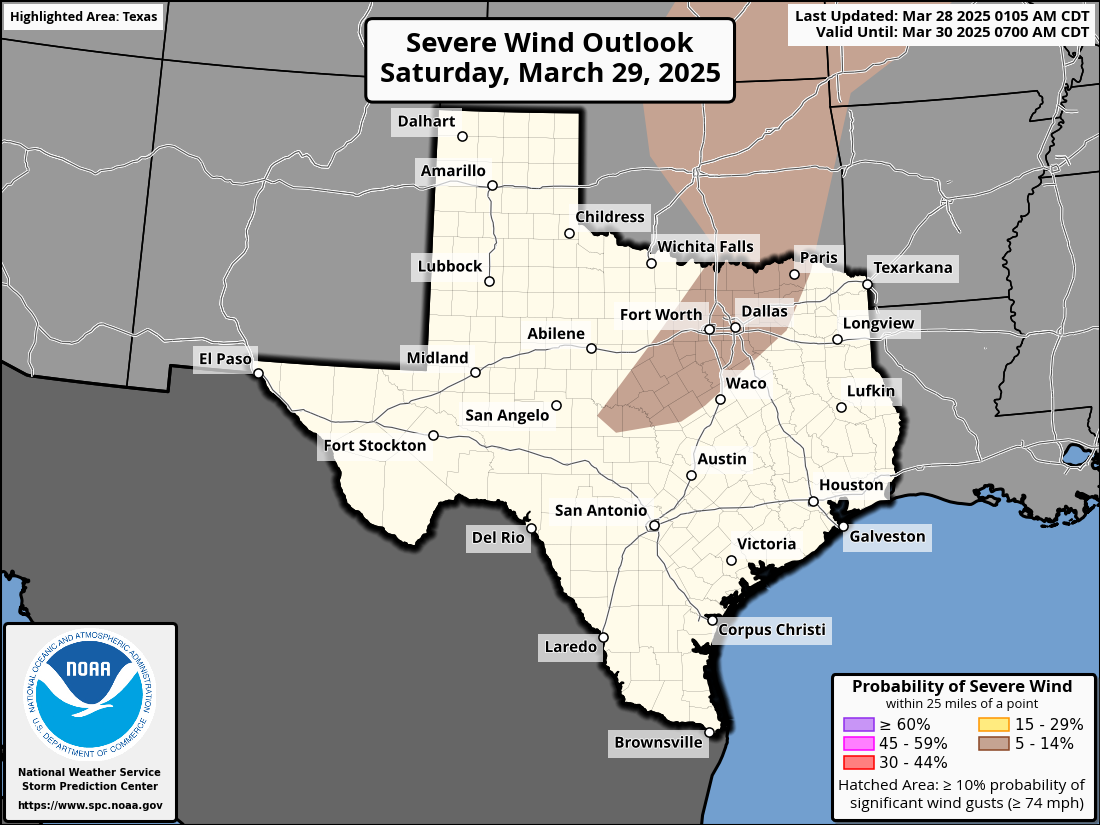
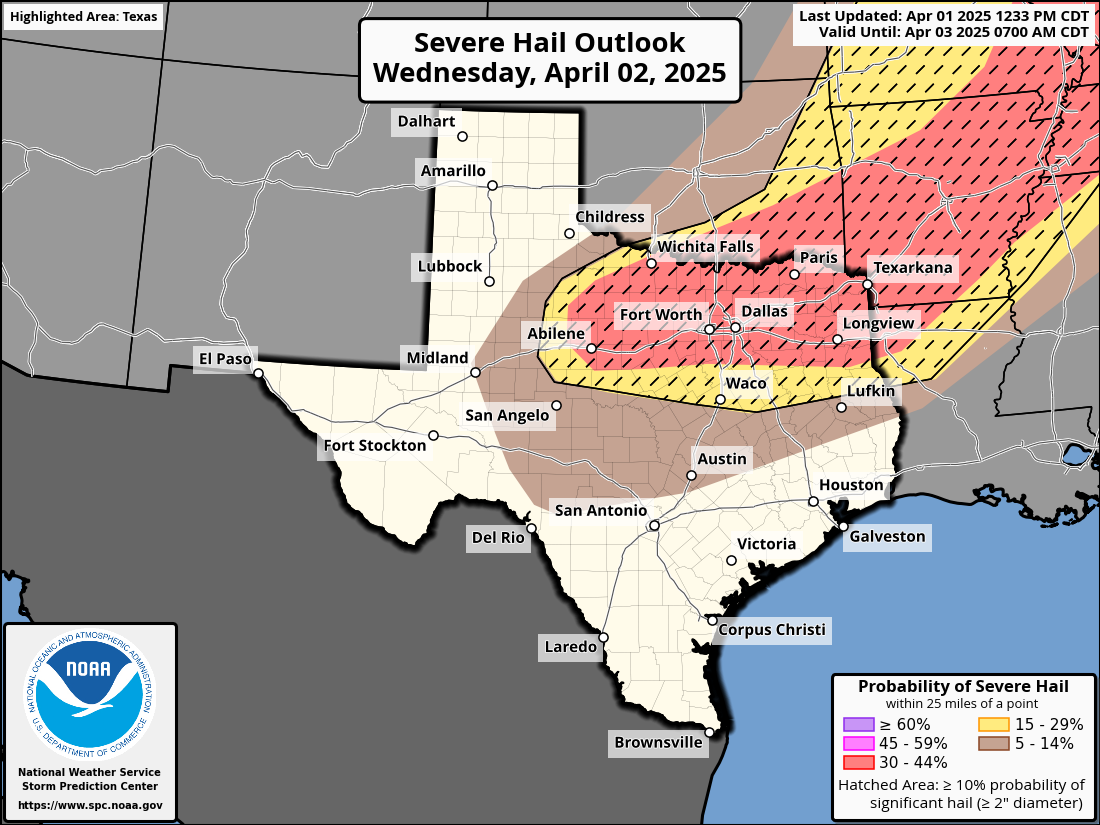
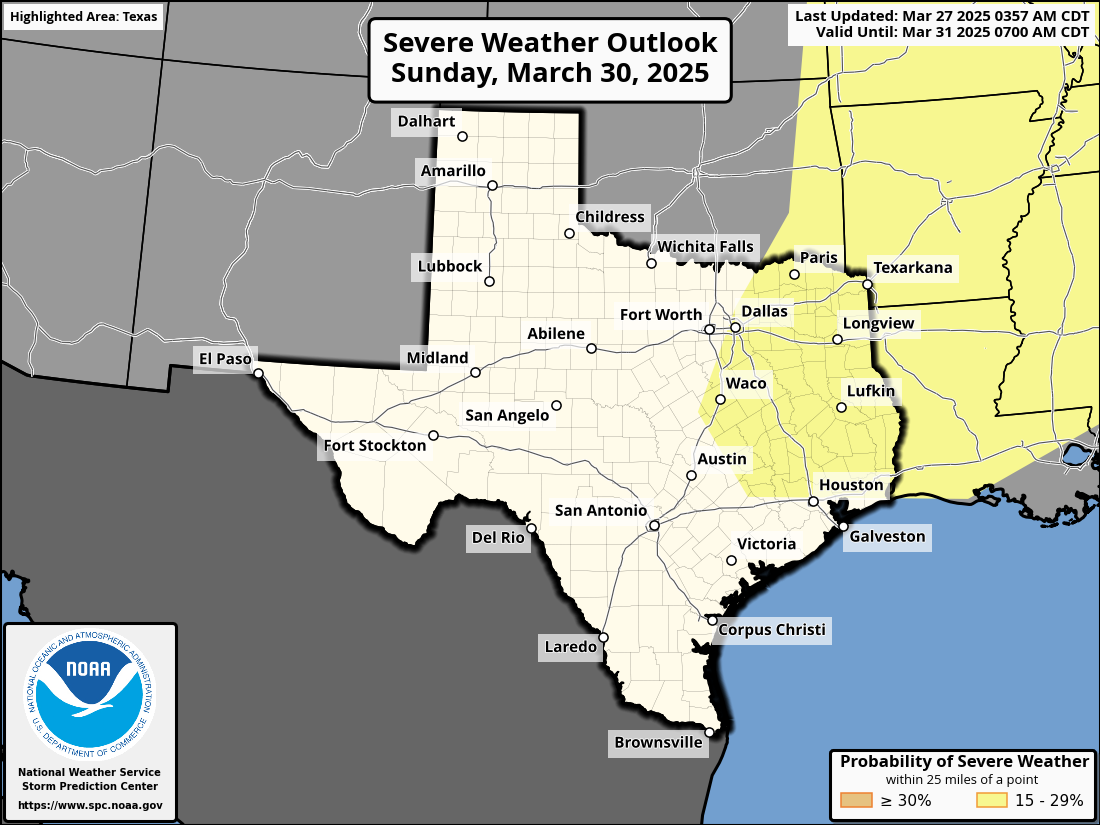
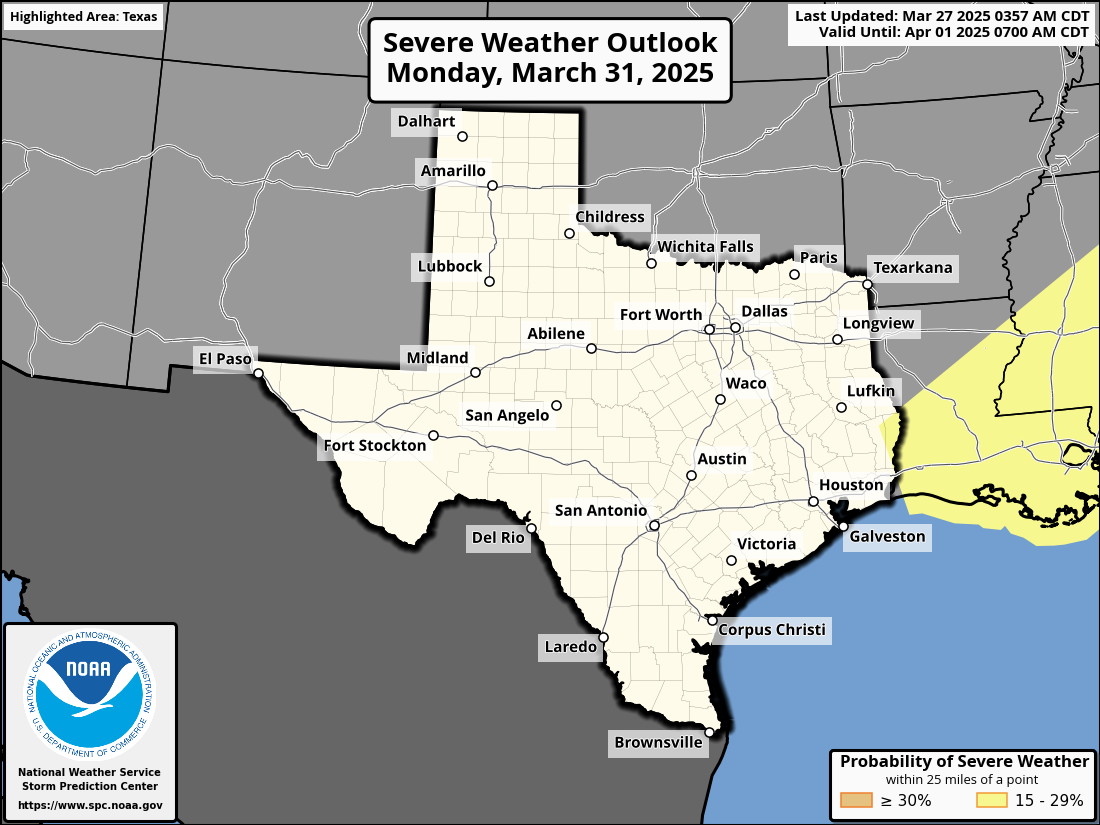
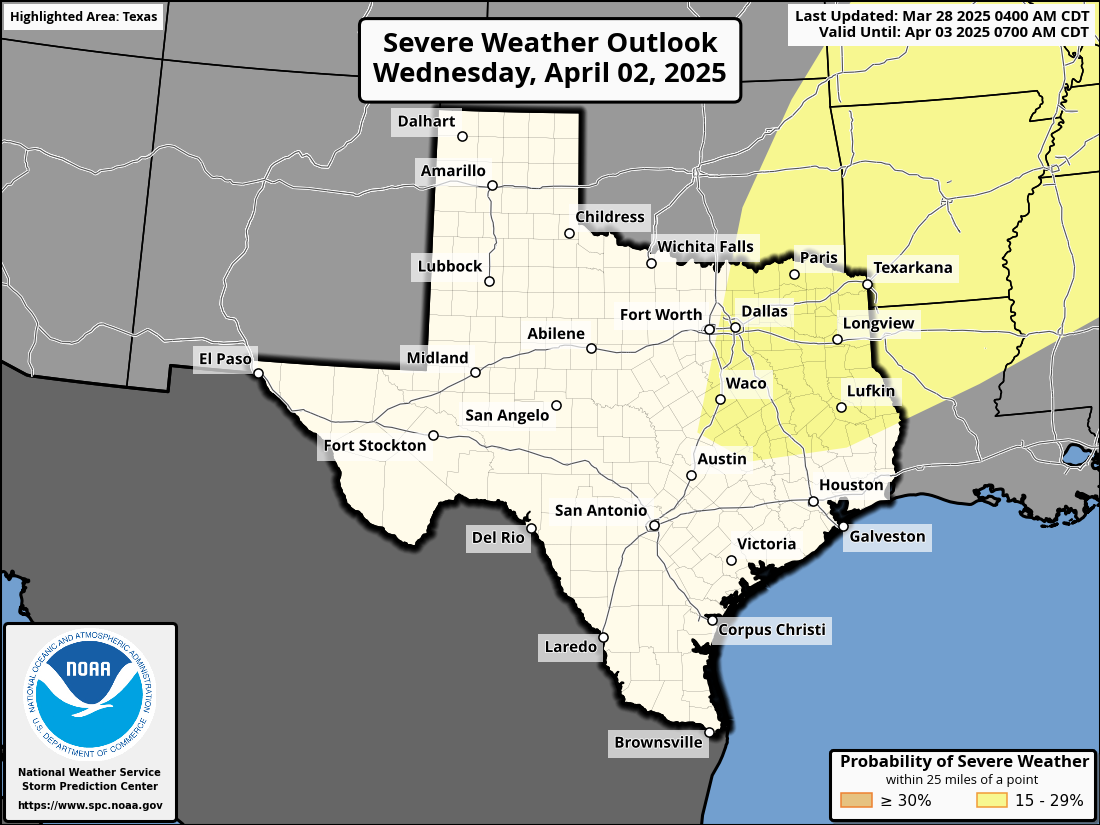
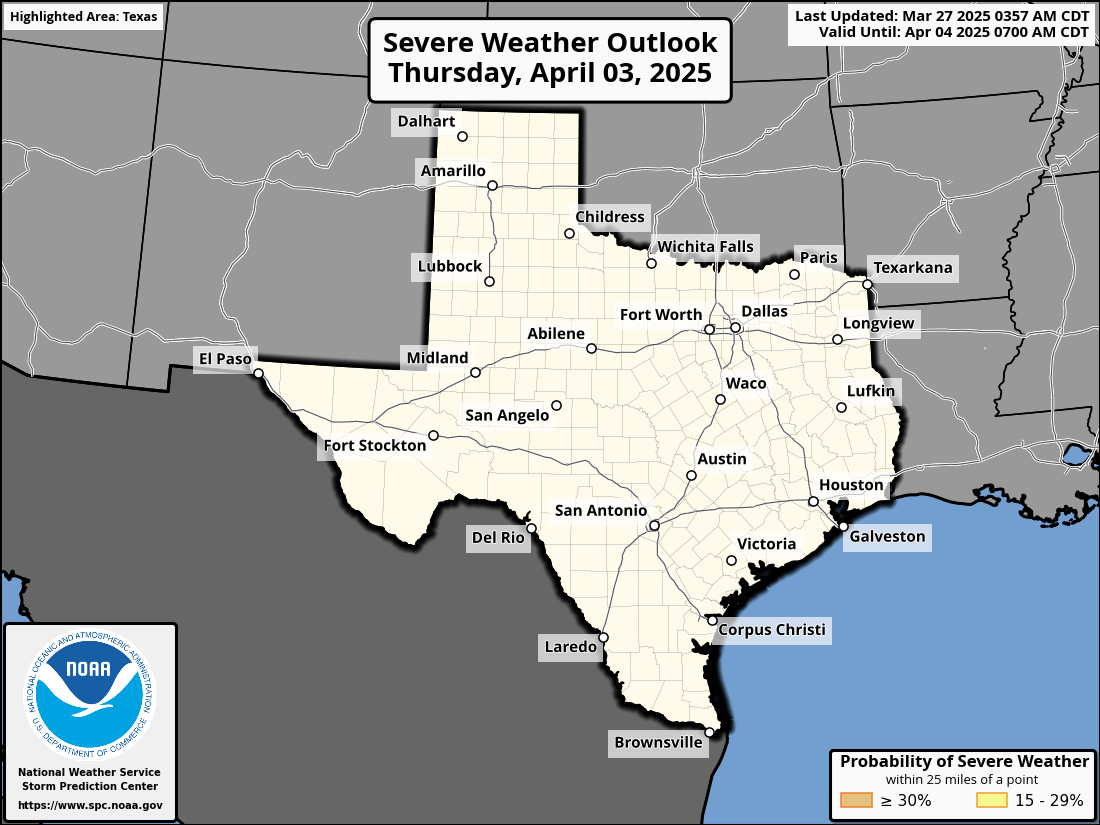
| SPC Convective Outlooks
Know severe weather chances for the days ahead in North Texas
Understanding SPC Outlooks
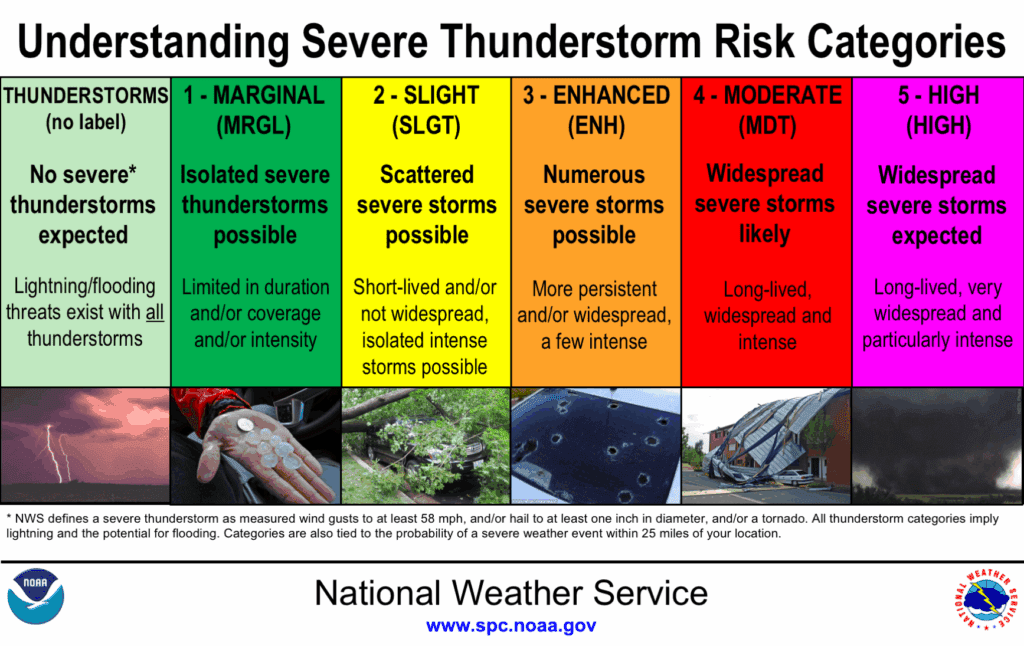
🟢 Thunderstorms
- Non-severe storms expected.
- Still includes lightning, heavy rain, and gusty winds.
Main Threats:
- ⚡ Frequent lightning
- 🌧️ Localized heavy rain
- 💨 Gusty winds
🟢 Marginal Risk
- Isolated severe storms possible.
- Short-lived or not widespread.
Main Threats:
- ☄️ Small hail
- 💨 Brief damaging winds
- 🌪 Low tornado risk
🟡 Slight Risk
- Scattered severe storms.
- A few may be intense.
Main Threats:
- ☄️ Large hail
- 💨 Damaging winds
- 🌪 Isolated tornadoes
🟠 Enhanced Risk
- Numerous severe storms expected.
- More persistent and organized.
Main Threats:
- ☄️ Very large hail
- 💨 Widespread damaging winds
- 🌪 A few strong tornadoes
🔴 Moderate Risk
- Widespread severe storms likely.
- Long-lived and intense.
Main Threats:
- 🌪 Strong, long-track tornadoes
- 💨 Widespread wind damage
- ☄️ Destructive hail
🟣 High Risk
- Severe weather outbreak expected.
- Most dangerous setup.
Main Threats:
- 🌪 Violent, long-track tornadoes
- 💨 Destructive straight-line winds
- ☄️ Giant hail
-

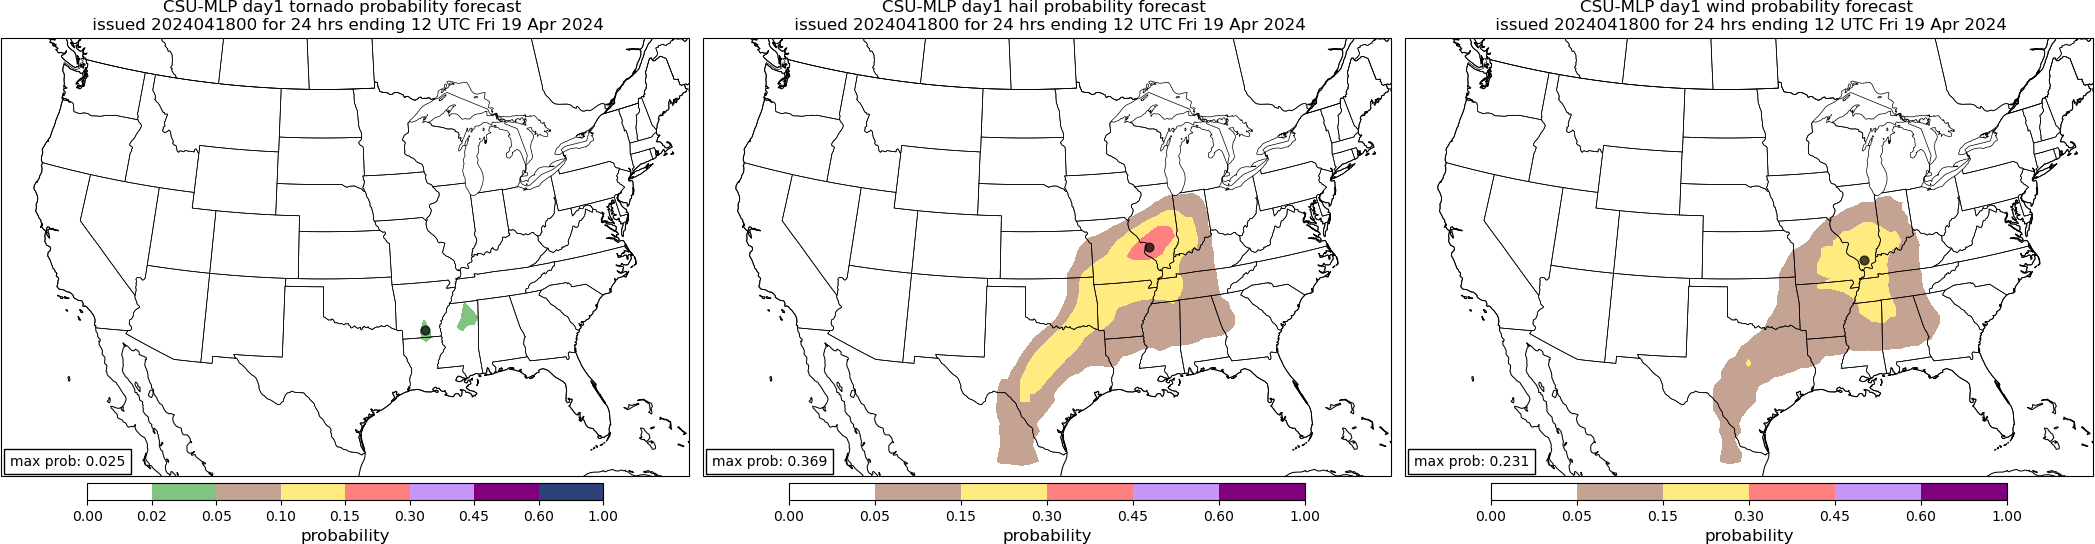
Day 1
-
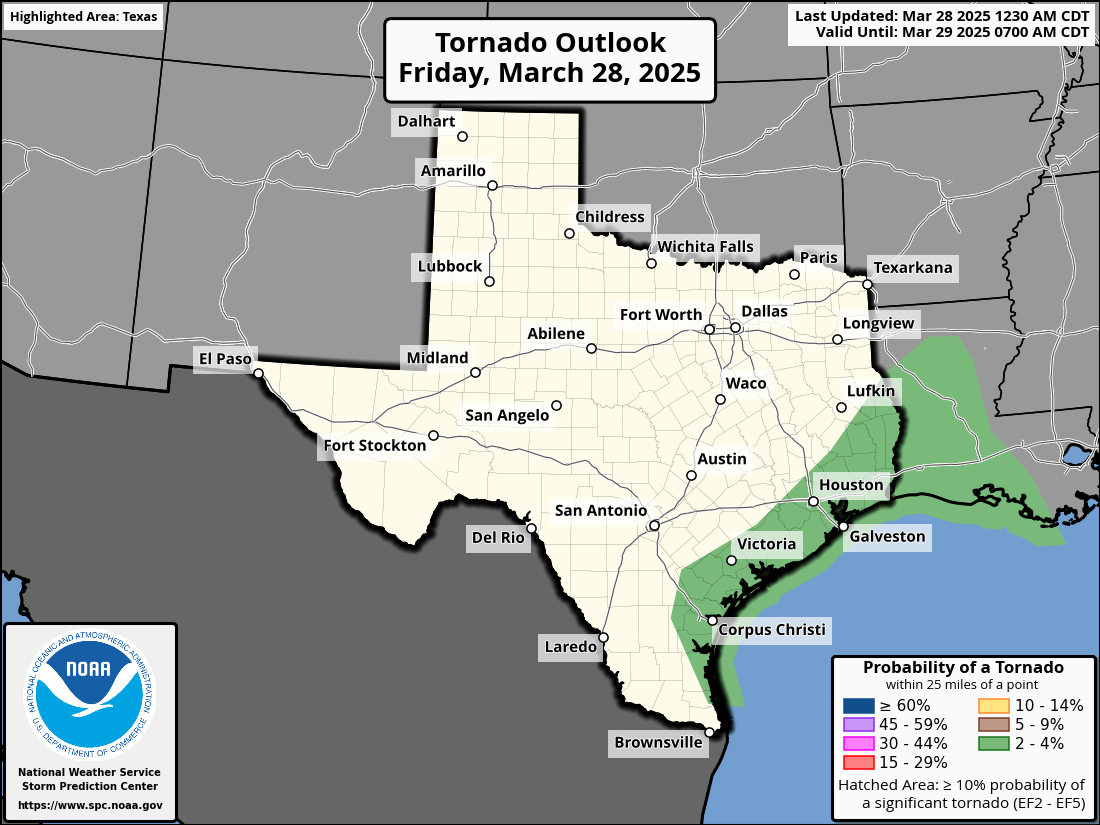
Tornado Risk
-
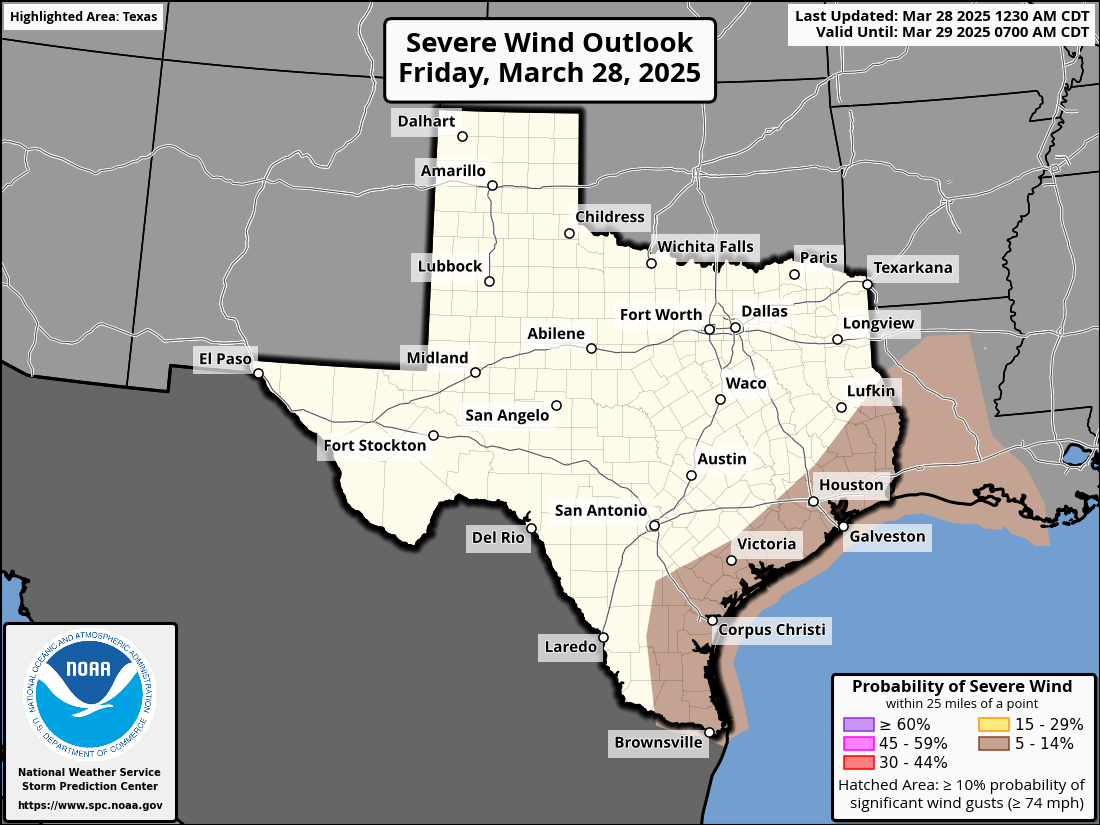
Wind Risk
-
Hail Risk

-
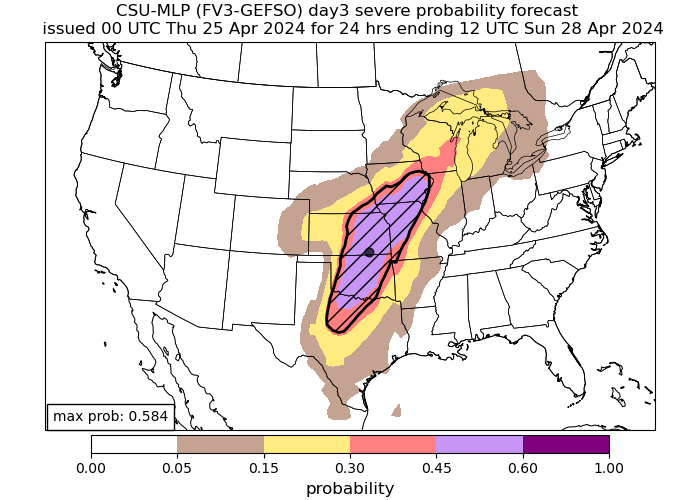
Day 3
-
Probability
-
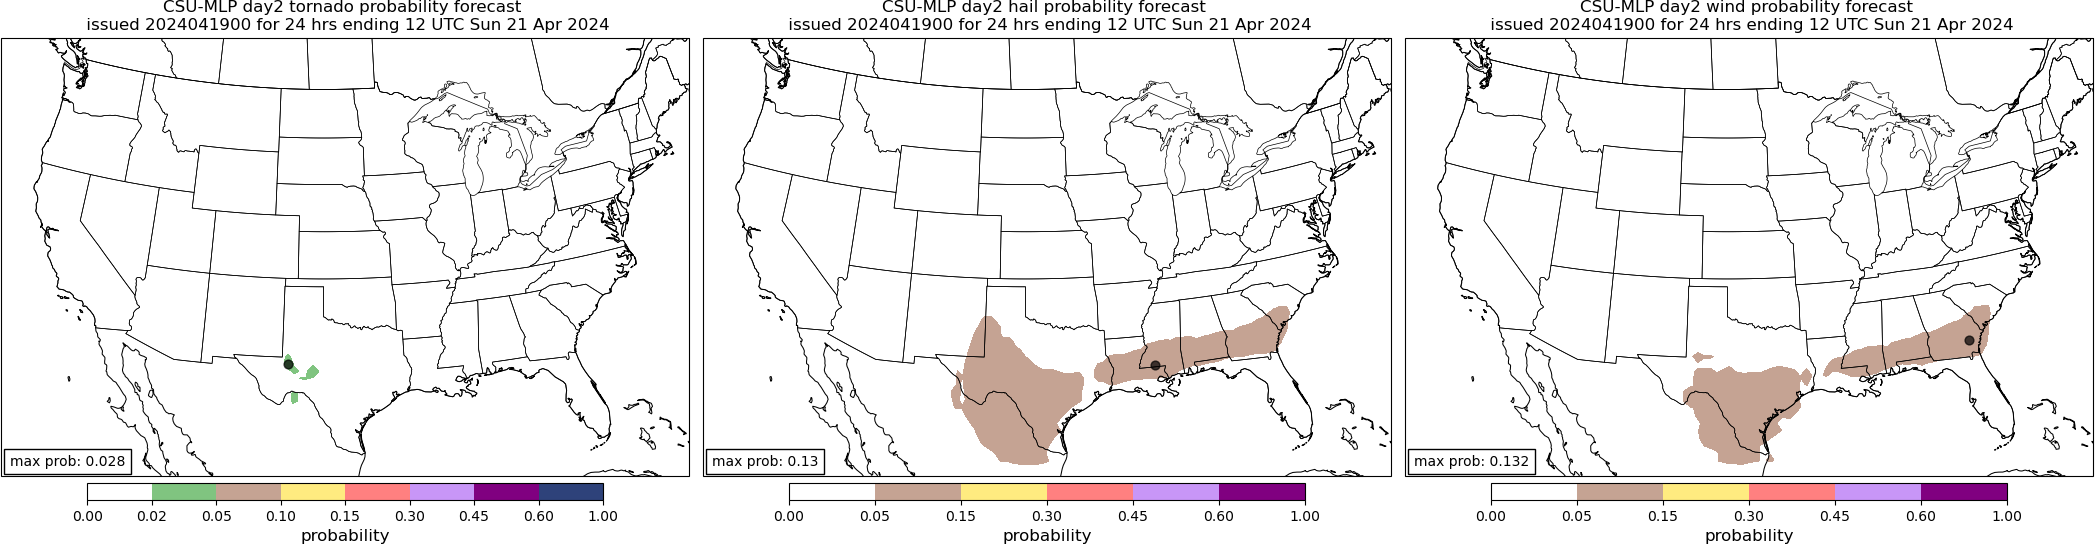
Day 2
-
Tornado Risk
-
Wind Risk
-
Hail Risk
-
Day 4
-
Day 5
-
Day 6
-
Day 7
-
Day 8

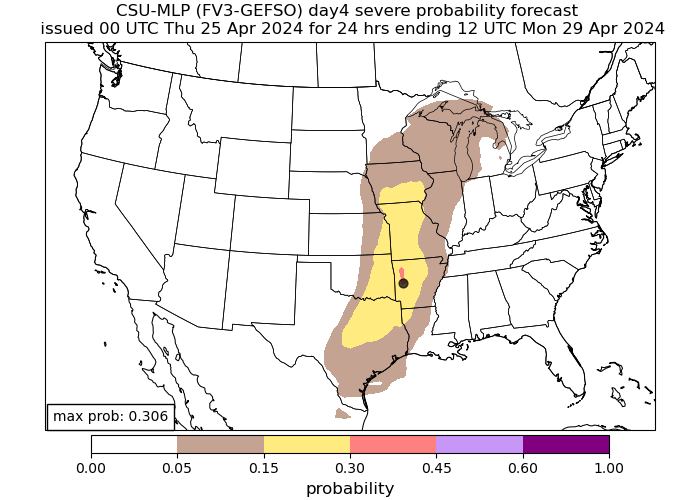
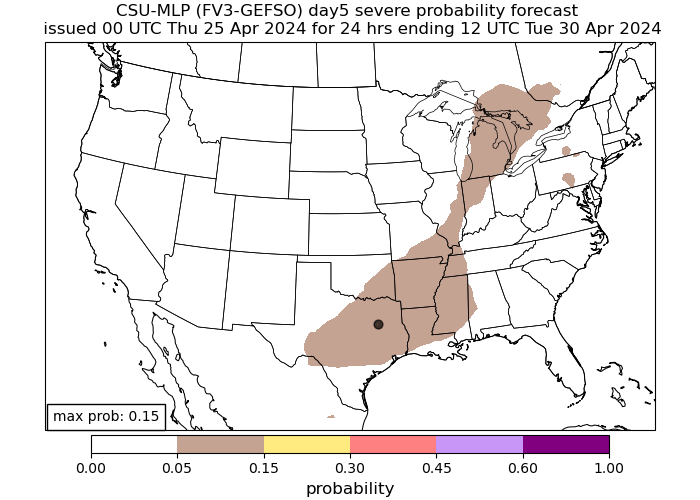
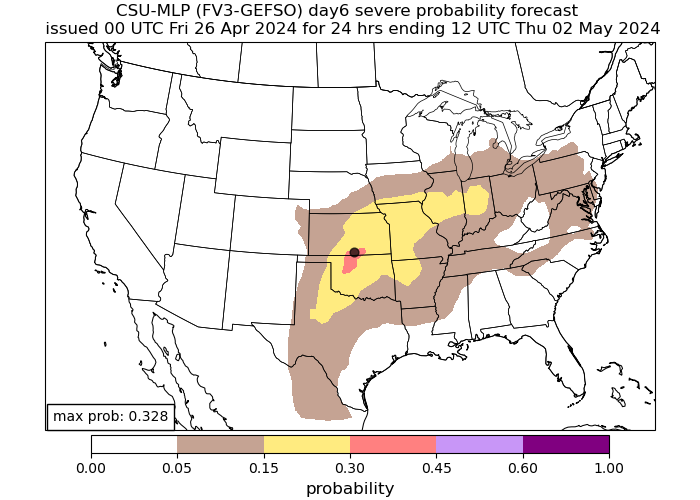
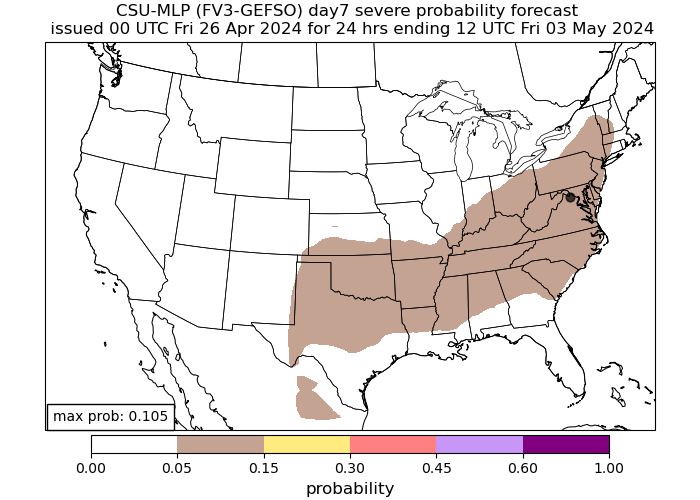
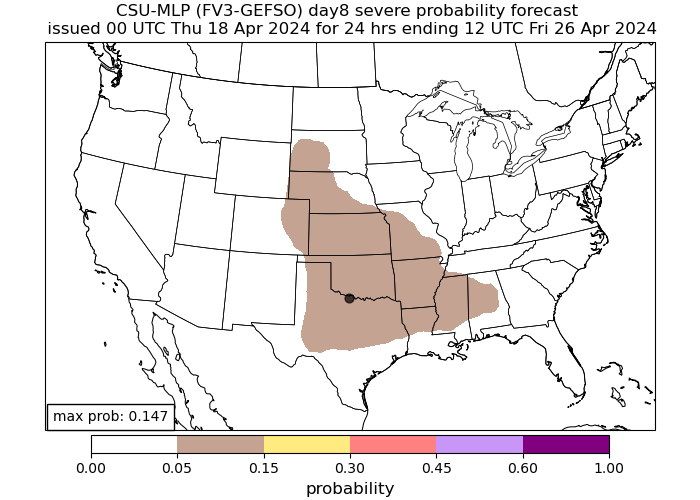
CSU Machine-Learning Severe Outlook
Understanding the CSU Weather Model
The CSU (Colorado State University) machine-learning weather model refers to a suite of numerical weather prediction models developed and maintained by the Department of Atmospheric Science at Colorado State University. These models are used for both research and operational weather forecasting. The research CSU specializes in involves the prediction of extreme weather hazards via statistical postprocessing techniques. These models forecast farther out than SPC models can in most cases, giving a good idea to the general public about what severe weather events may come in the near future.
-
Day 1
-
Day 2
-
Day 3
-
Day 4
-
Day 5
-
Day 6
-
Day 7
-
Day 8
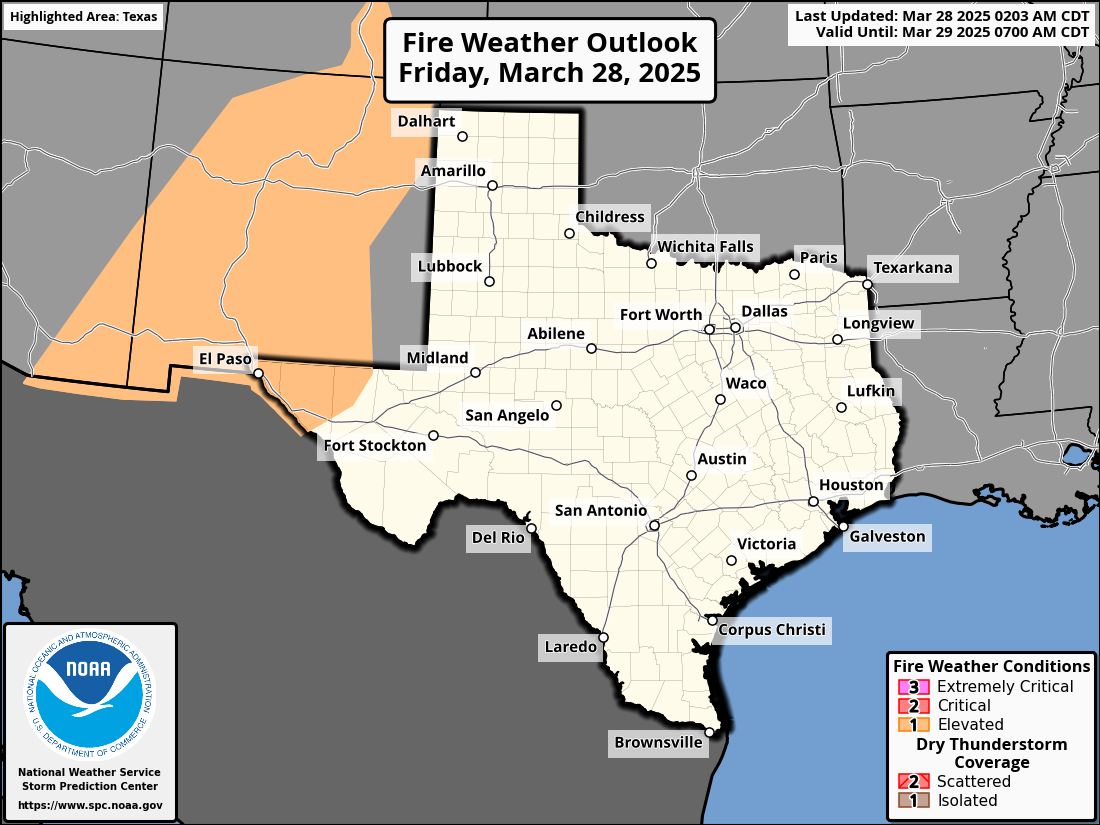
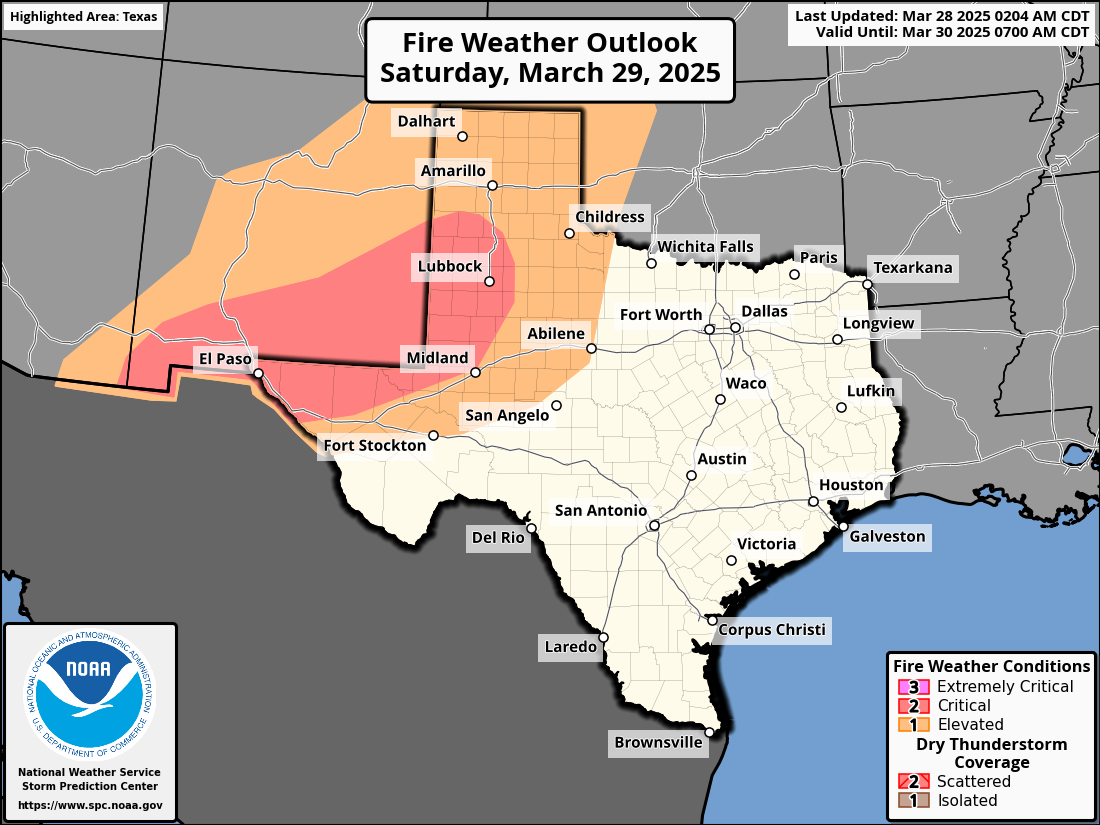
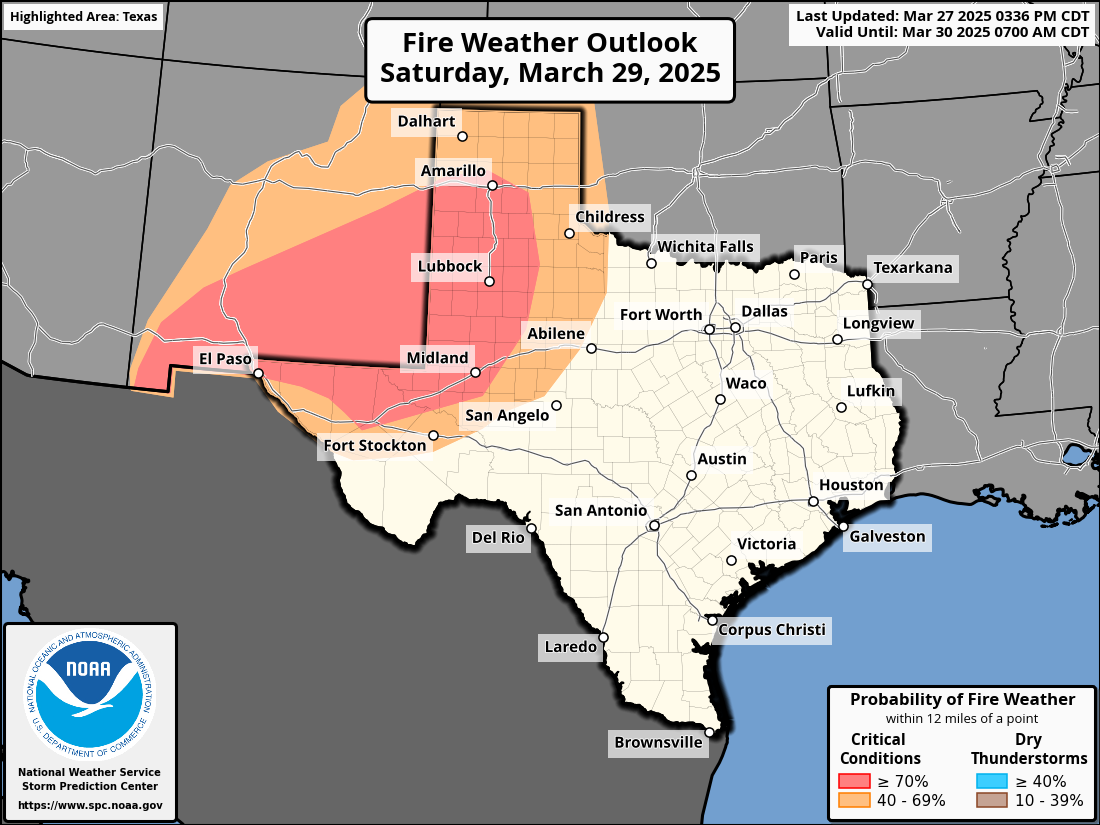
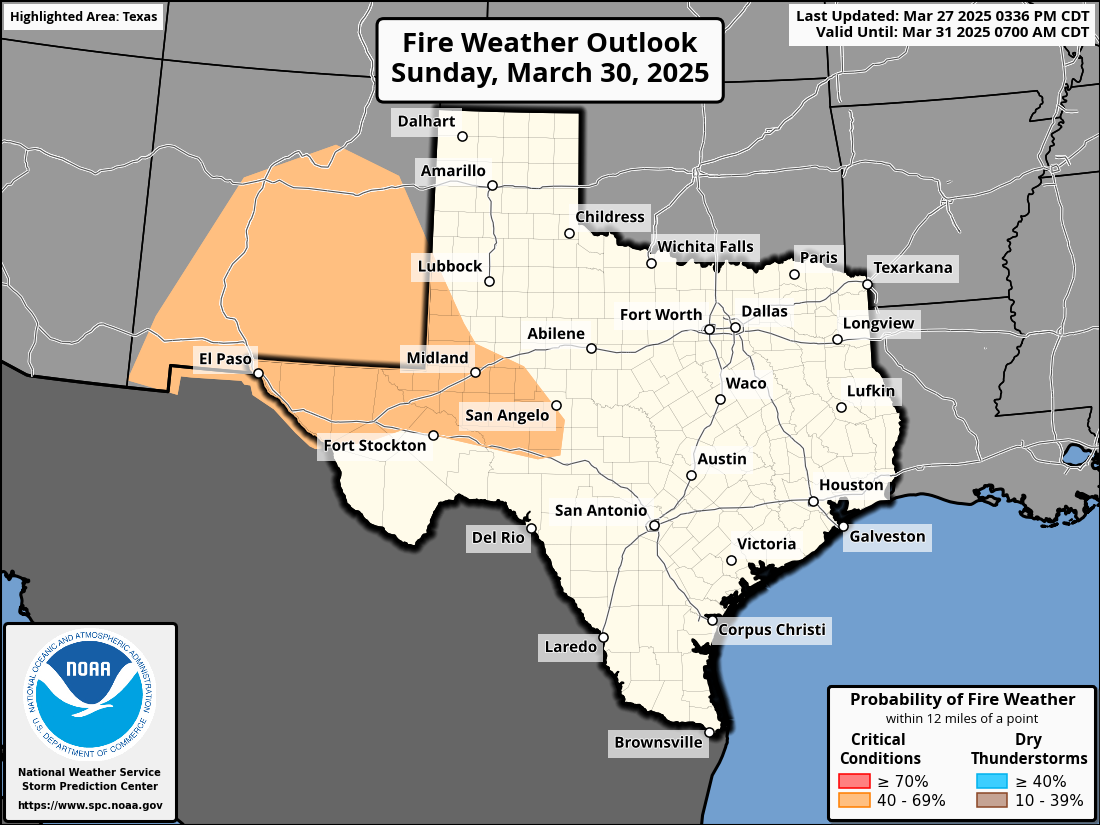
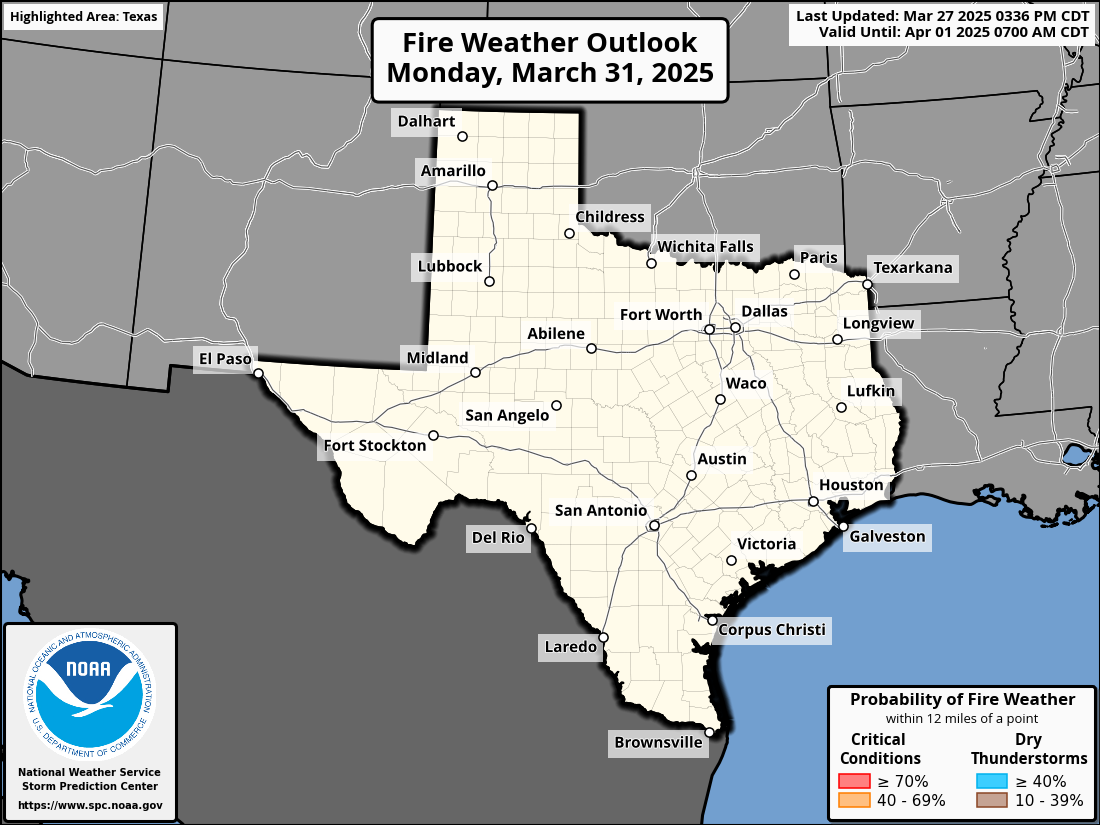
Fire Weather Outlook
-
Day 1
-
Day 2
-
Day 3
-
Day 4
-
Day 5
Flash Flood Outlook
-
Day 1
-
Day 2
-
Day 3
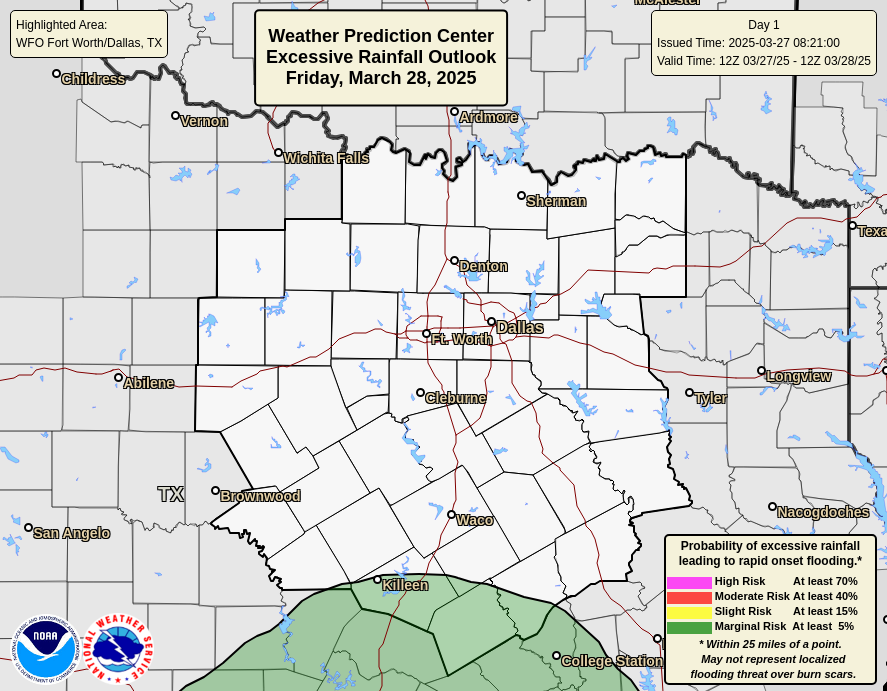
Rainfall Outlook
Rainfall Outlook Info
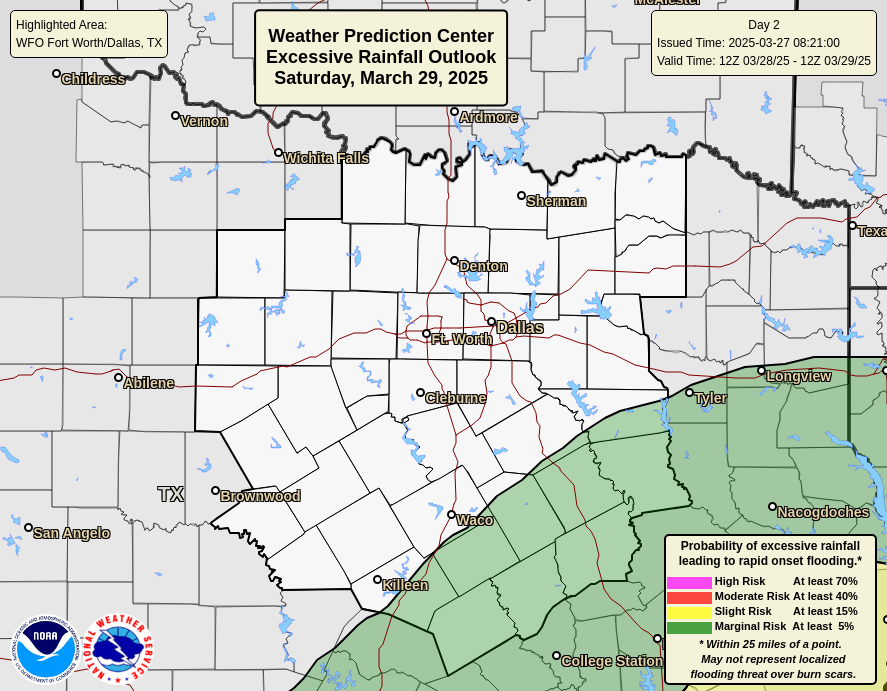
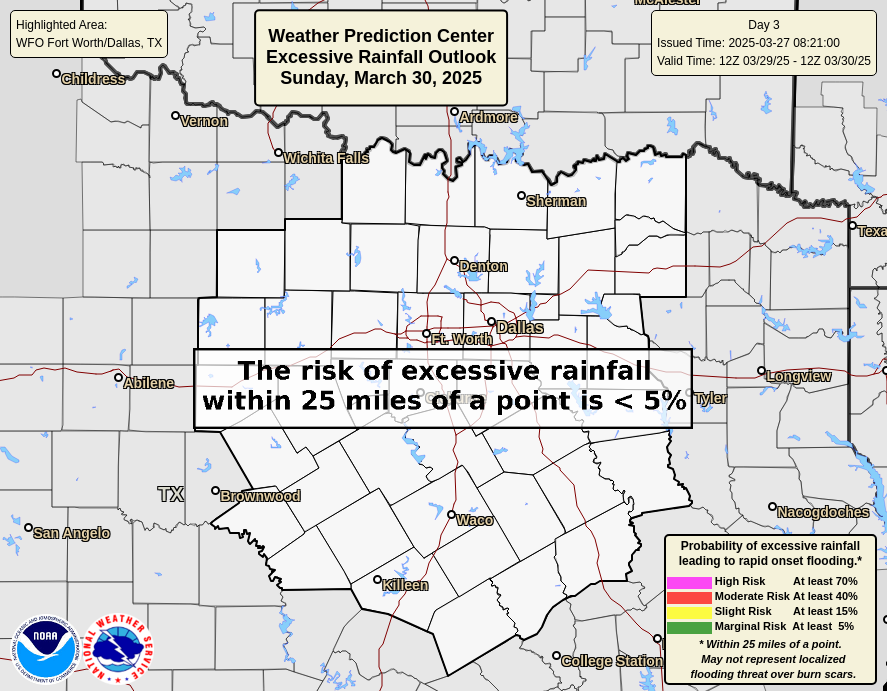
The Excessive Rainfall Outlook is a short-range graphical product issued by the Weather Prediction Center (WPC). This map provides a detailed snapshot of expected weather hazards and precipitation for the current day across the DFW area.
🌧️ What the Map Shows
This forecast highlights expected precipitation types, intensities, and coverage for the next 6 to 24 hours. It may include:
- Rainfall zones with expected totals
- Thunderstorm areas, including potential for severe weather
- Snow or wintry mix (in colder seasons)
- Frontal boundaries and surface features
- Hazard overlays such as flash flood risk or excessive rainfall outlooks
The map is color-coded and annotated to help users quickly identify where and when impactful weather is expected.
🧠 How This Forecast Is Made
The Day 1 CWA map is created using a blend of:
- High-resolution numerical models (e.g., HRRR, NAM, GFS)
- Radar and satellite trends
- Surface observations
- Local meteorologist expertise from the Fort Worth NWS office
- WPC guidance on precipitation and hazard probabilities
This combination allows forecasters to fine-tune the forecast for local terrain, urban impacts, and mesoscale features that national models may overlook.
-
Day 1
-
Day 2
-
Day 3
Forecast Maps
Forecast Map Info
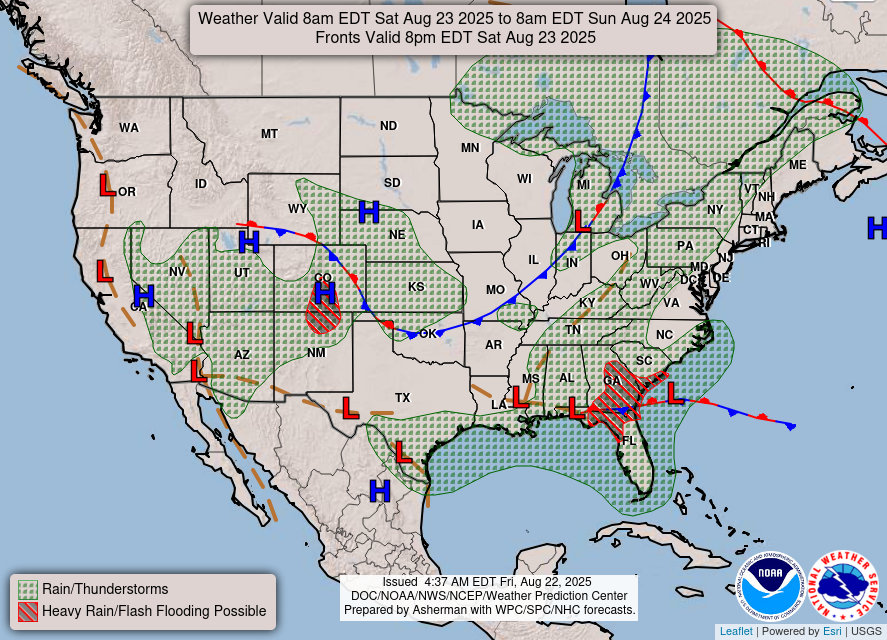
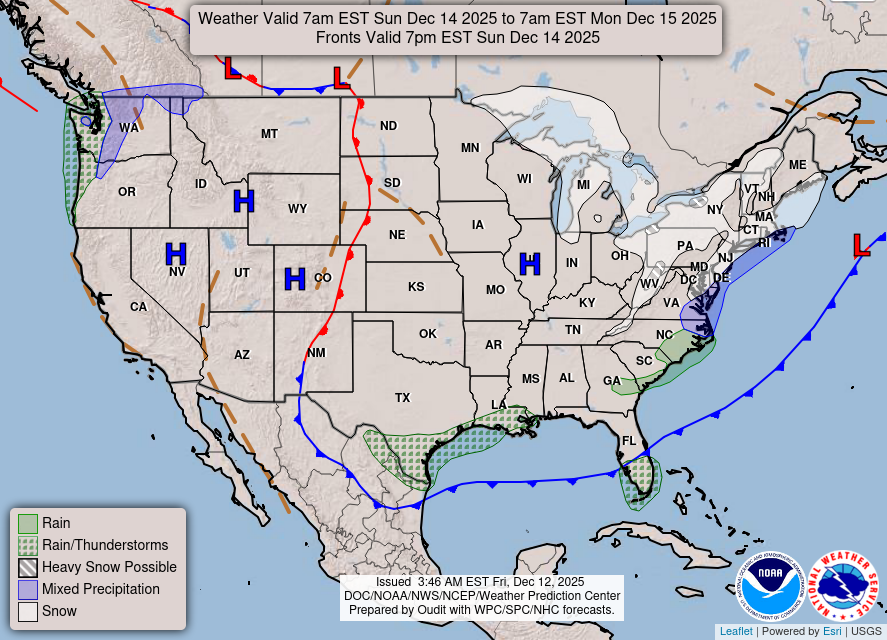
The National Forecast Chart is a comprehensive surface weather map issued daily by the Weather Prediction Center (WPC). It provides a nationwide overview of expected weather conditions for the current day.
🌦️ What the Map Shows
This chart displays a wide range of surface weather features, including:
- High and Low Pressure Systems (marked with “H” and “L”)
-
Frontal Boundaries:
- Cold fronts (blue lines with triangles)
- Warm fronts (red lines with semicircles)
- Stationary fronts (alternating red/blue)
- Occluded fronts (purple lines)
- Troughs and Drylines
-
Areas of Significant Weather, such as:
- ❄️ Heavy Snowfall
- 🌧️ Flash Flooding
- ⚡ Severe Thunderstorms
- 🌨️ Freezing Rain
These hazards are often highlighted with hatched or shaded regions, making it easy to identify where impactful weather is expected.
🧠 How This Forecast Is Made
The National Forecast Chart is created using:
- Model guidance from the National Centers for Environmental Prediction (NCEP)
- Surface analysis and short-range forecasts
- Collaboration with local NWS offices
- Expert interpretation by WPC meteorologists
It synthesizes data from multiple sources to provide a “big picture” view of the day’s weather across the continental U.S.
-
Day 1
-
Day 2
-
Day 3

Short-Range Climate Outlook
Temperature Outlook Info
The 6–10 Day and 8–14 Day Outlooks are short-range climate forecasts issued daily by the Climate Prediction Center (CPC). This outlook provides a snapshot of expected temperature trends across the United States, helping individuals, businesses, and communities prepare for upcoming weather patterns.
🌡️ Temperature Outlooks
These maps show the probability that temperatures will be:
- Above Normal (shaded in orange to red)
- Near Normal (shaded in gray)
- Below Normal (shaded in blue)
The deeper the color, the higher the confidence in that outcome. For example, a dark red area indicates a strong likelihood of warmer-than-average temperatures.
🧠 How These Forecasts Are Made
The CPC uses a blend of:
- Numerical weather models
- Atmospheric circulation patterns
- Sea surface temperatures
- Historical analogs
These tools help forecasters assess large-scale trends rather than specific daily weather events.
-
6-10 Day Temperature
-
8-14 Day Temperature


Precipitation Outlook Info
The 6–10 Day and 8–14 Day Outlooks are short-range climate forecasts issued daily by the Climate Prediction Center (CPC). This outlook provides a snapshot of expected precipitation trends across the United States, helping individuals, businesses, and communities prepare for upcoming weather patterns.
🌧️ Precipitation Outlooks
These maps indicate the probability of precipitation being:
- Above Normal (shaded in green)
- Near Normal (shaded in gray)
- Below Normal (shaded in brown)
Again, darker shades reflect higher confidence in the forecast.
🧠 How These Forecasts Are Made
The CPC uses a blend of:
- Numerical weather models
- Atmospheric circulation patterns
- Sea surface temperatures
- Historical analogs
These tools help forecasters assess large-scale trends rather than specific daily weather events.
-
6-10 Day Precipitation
-
8-14 Day Precipitation


Long-Range Climate Outlook
Temperature Outlook Info
These seasonal 3-month span outlooks are long-range climate forecasts issued every month by the Climate Prediction Center (CPC). This outlook provides a snapshot of expected temperature trends across the United States, helping individuals, businesses, and communities prepare for upcoming weather patterns.
🌡️ Temperature Outlooks
These maps show the probability that temperatures will be:
- Above Normal (shaded in orange to red)
- Near Normal (shaded in gray)
- Below Normal (shaded in blue)
The deeper the color, the higher the confidence in that outcome. For example, a dark red area indicates a strong likelihood of warmer-than-average temperatures.
🧠 How These Forecasts Are Made
The CPC uses a blend of:
- Numerical weather models
- Atmospheric circulation patterns
- Sea surface temperatures
- Historical analogs
These tools help forecasters assess large-scale trends rather than specific daily weather events.
-
Current Month
-
3 Months
-
6 Months
-
9 Months
-
12 Months


Precipitation Outlook Info
These seasonal 3-month span outlooks are long-range climate forecasts issued every month by the Climate Prediction Center (CPC). This outlook provides a snapshot of expected precipitation trends across the United States, helping individuals, businesses, and communities prepare for upcoming weather patterns.
🌧️ Precipitation Outlooks
These maps indicate the probability of precipitation being:
- Above Normal (shaded in green)
- Near Normal (shaded in gray)
- Below Normal (shaded in brown)
Again, darker shades reflect higher confidence in the forecast.
🧠 How These Forecasts Are Made
The CPC uses a blend of:
- Numerical weather models
- Atmospheric circulation patterns
- Sea surface temperatures
- Historical analogs
These tools help forecasters assess large-scale trends rather than specific daily weather events.
-
Current Month
-
3 Months
-
6 Months
-
9 Months
-
12 Months


| Space Weather Center
View the latest northern lights forecast, track upcoming celestial events like meteor showers, and so much more!
| Historical Weather Data
See current conditions, chart data, and daily / monthly / yearly weather data graphs!
| Winter Weather Center
Winter Weather Center is a compact yet informative page filled with a few different types of useful weather models for Winter Weather Forecasting!
| Tornado Center
View the latest weather models for predicting tornado risk in North Texas today
Today’s Weather Sounding
Weather Sounding Info
🎈 What Is a Weather Sounding?
A weather sounding is a vertical profile of the atmosphere captured by a weather balloon, officially called a radiosonde. These balloons are launched 2–3 times daily by National Weather Service offices nationwide, and collect crucial upper-air measurements:
- 🌡️ Temperature
- 💧 Dewpoint and moisture
- 🌬️ Wind speed and direction
- 🌪️ Shear, instability, and storm ingredients
This data is plotted into a sounding chart, like the one shown below, which can be difficult to interpret at first glance. WC Tornado Center will soon offer a “How to Read a Weather Sounding” guide to help beginners master the visuals.
🔍 Tornado Forecasting: What to Look For
Meteorologists examine weather soundings to assess the potential for severe storms and tornadoes. Here’s what you should be scanning for:
🔥 Atmospheric Instability
- MU CAPE (Most Unstable CAPE) Ideal values: 2500+ J/kg Indicates available energy for thunderstorm updrafts. The higher, the more explosive the storms.
- K-Index ≥ 26 A simple measure of thunderstorm potential.
- Lifted Index (LI ≤ -4) Tells how buoyant rising air parcels are. More negative = stronger lift.
- Effective Layer CAPE (ELCAPE) CAPE based on the storm’s likely layer of development. Values >2000 J/kg suggest strong instability.
- Convective Temperature The surface temperature required to initiate thunderstorms. If forecast highs exceed this, storm initiation is likely.
- LCL Height (Lifted Condensation Level) <1000 m is ideal for tornado formation — low cloud bases help sustain rotation near ground level.
💨 Wind Shear & Rotation
- Hodograph Critical Angle ≈ 90° A near-right angle between low-level wind and storm inflow supports rotating updrafts.
- BRN Shear = 20–45 m/s Assesses storm organization potential. Sweet spot for supercell development.
-
Storm-Relative Helicity (SRH)
- 0–1 km SRH > 150 m²/s²
- 0–3 km SRH > 250 m²/s² Both indicate strong potential for rotating storms and tornadoes.
- Effective Bulk Wind Difference (EBWD) Values >40 knots point to favorable deep-layer shear.
- Energy-Helicity Index (EHI > 2) Combines instability and rotation. EHI values >4 are especially tornado-conducive.
🚫 Suppression vs. Activation
-
Convective Inhibition (CIN) Overlapping of the red temperature line with the brown parcel ascent line at the surface indicates CIN (also called Inverse CAPE).
- CIN < -50 J/kg is often breakable.
- CIN > -100 J/kg can suppress convection unless strong forcing exists.
🚨 Composite Parameters
-
Significant Tornado Parameter (STP) Combines moisture, instability, shear, and cloud base height.
- STP > 1 = enhanced tornado risk
- STP > 2 = concern for significant tornadoes
-
Supercell Composite Parameter (SCP)
- SCP > 1 supports supercell development.
- SARS Sounding Analogs Historical matches can signal environments favorable for SUPERCELLS and SIGNIFICANT HAIL.
-
Highlighted Risk Zones (on sounding overlays):
- Supercell, Left Supercell, STP, Sig Hail Color coding in orange or red means these hazards are strongly supported by the environment.
Weather Observations
-

Weather Sounding
-

Bulk Wind Shear
-

SR Helicity
-
850mb Temp Advection
-

850mb Analysis
-

Surface Observations
-

Visible Satellite
-
Temp / Wind / Dewpoint
-
3-Hour Temperature Change
-
3-Hour Dewpoint Change
-

Drought Monitor
Weather Sounding
A Weather Sounding is a reading gathered by a weather balloon that creates an atmospherics profile of various kinds of weather data. These soundings (below) gather temperature, dewpoint, moisture, wind speed, wind direction, and various severe storm ingredients present in the atmosphere. All this upper-air data is gathered by radiosondes which are on weather balloons that launch at NWS offices nationwide 2-3 times daily (sometimes dependent on station). This chart may be very confusing and foreign to some. For a tutorial to understand the WC Tornado Center graph below, view WC’s page on “How to Read a Weather Sounding” (coming soon)
Some basic things to look for on a Weather Sounding for tornado forecasting would be:
- Generally high CAPE (Convective Available Potential Energy). Values around 2500+ CAPE is favorable to tornado development due to the high instability in the atmosphere. Find this value under Most Unstable CAPE (MU CAPE)
- K-Index of 26 or higher. K-Index is another method of measuring instability in the atmosphere.
- Lifted Index (LI) of less than -4. Measures the ability for a parcel to lift in the atmosphere.
- Hodograph critical angle as close to 90 degrees as possible. This indicates good wind shear for tornadoes.
- BRN Shear between 20-45 m/s.
- The red temperature line is not overlapping the brown dotted rising air parcel line down closer to the surface. If it was overlapping, it would indicate that there is Convective Inhibition (Inverse CAPE). Whenever this exists, it will prevent severe storm development and the CAPE will hold.
- SARS Sounding Analog indicating matches for SUPERCELL and SGFNT HAIL.
- Any of these categories colored orange or red: Supercell, Left Supercell, STP, and Sig Hail.
Bulk Wind Shear
Bulk Wind Shear is the change in wind speed or direction in the lower part of the atmosphere where storm development will first develop (first 3.5 miles). This map displays the effective values. Any values 40 Knots or more is favorable environment for supercell development. The larger the number, the more shear there is which results in better potential for supercell development.
Some basic things to look for on these maps for tornado forecasting would be:
- Bulk Shear values of 40+ Knots
SR Helicity
In the realm of meteorology, SR helicity, or Storm-Relative Helicity, is a critical parameter used to assess the potential for rotating updrafts within severe thunderstorms. It quantifies the relative spin in the atmosphere by considering the vertical wind shear and storm motion in a given region. High SR helicity values indicate a favorable environment for the development of supercell thunderstorms. Storm-Relative Helicity (SRH) is such a crucial parameter in that helps assess the potential for rotating updrafts in thunderstorms. SRH values provide insight into the atmosphere’s propensity for severe weather, particularly tornadoes. Here’s a general list of what different SR Helicity numbers may imply:
-
Low SR Helicity (0-100 m²/s²):
- Limited or no potential for rotating updrafts.
- Thunderstorms are less likely to produce tornadoes.
-
Moderate SR Helicity (100-200 m²/s²):
- A modest potential for rotating updrafts.
- Isolated tornadoes may be possible but not guaranteed.
-
High SR Helicity (200-400 m²/s²):
- A significant potential for rotating updrafts.
- Conditions are favorable for supercell development and tornado formation.
-
Very High SR Helicity (400 m²/s² and above):
- An extremely favorable environment for rotating updrafts.
- Increased likelihood of strong and long-lived tornadoes.
850mb Temp Advection
850mb Temperature Advection is a critical meteorological parameter that describes the horizontal movement of temperature changes within the atmosphere at the 850 millibar pressure level, which typically resides a few thousand feet above the Earth’s surface. This concept is indispensable for weather forecasting as it provides insights into evolving temperature patterns and their impact on local weather.
Here’s a breakdown of what different 850mb temperature advection values mean:
- Positive Advection: When positive values are observed, it indicates the horizontal transport of warmer air into an area. This results in increasing temperatures and can lead to more favorable conditions for convective processes and potentially rising temperatures.
- Negative Advection: Negative values signify the horizontal transport of cooler air into a region. This results in decreasing temperatures and can lead to cooling trends and potentially less favorable conditions for convective processes.
- Weak Advection: When the values are close to zero, it suggests minimal temperature changes and relatively stable weather conditions.
- Strong Advection: Large positive or negative values imply significant temperature variations are expected. This can indicate more dynamic weather patterns, including the potential for temperature-driven weather events like thunderstorms or temperature drops leading to cold fronts.
850mb Analysis
850mb analysis, in meteorology, refers to the examination and interpretation of various atmospheric parameters at the 850 millibar pressure level, which typically occurs several thousand feet above the Earth’s surface. This analysis is instrumental in weather forecasting, offering critical insights into atmospheric conditions. Here’s a list of number values associated with 850mb analysis and their implications:
-
Temperature (in degrees Celsius):
- Positive values suggest warmer air at that level.
- Negative values indicate cooler air.
-
Dew Point (in degrees Celsius):
- A higher dew point suggests more moisture at this level.
- A lower dew point indicates drier air.
-
Wind Speed (in knots):
- Wind speed and direction provide information about horizontal wind flow, influencing weather systems.
-
Relative Humidity (as a percentage):
- High values suggest more saturated air.
- Low values indicate drier conditions.
Surface Observations
Surface observations refer to the collection of real-time weather data at or near the Earth’s surface. These data are crucial for weather forecasting, climate analysis, and monitoring local weather conditions. Surface observations typically include the following key parameters:
- Temperature (in degrees Celsius): The current air temperature provides information about how hot or cold it is at a specific location.
- Dew Point (in degrees Celsius): The dew point temperature indicates the air’s moisture content, with higher values signifying more humidity.
- Wind Speed (in knots or miles per hour): Wind speed and direction offer insights into the movement of air, influencing weather patterns.
- Relative Humidity (as a percentage): Relative humidity measures the air’s moisture content concerning its capacity to hold moisture, with higher values suggesting more saturation.
- Barometric Pressure (in hPa or mb): Barometric pressure reveals the weight of the atmosphere at a particular location and helps identify high or low-pressure systems.
- Precipitation (in inches or millimeters): Precipitation data record the amount of rain, snow, or other forms of moisture falling to the ground.
- Visibility (in miles or meters): Visibility describes how far one can see due to atmospheric conditions like fog, rain, or snow.
Visible Satellite
The Visible Satellite is a weather observation tool that captures images of the Earth’s surface and cloud cover in the visible spectrum of light. It’s a valuable resource for meteorologists and weather enthusiasts, aiding in the monitoring and analysis of weather systems and conditions. Here’s a list of number values associated with Visible Satellite imagery and what they signify:
- Brightness Temperature (in degrees Celsius): The brightness temperature is derived from the satellite’s sensor data and can indicate cloud cover and surface temperature. Lower values are often associated with cooler surfaces.
- Reflectance Values (in percentages): These values represent the amount of sunlight reflected by various surfaces, including land, water, and clouds. High values indicate highly reflective surfaces like snow or ice.
- Cloud Cover (in percentages): The extent of cloud cover, often categorized as clear, partly cloudy, or overcast, is determined by analyzing the brightness and texture of cloud formations.
- Daylight/Darkness: Visible satellite imagery is only available during daylight hours, so it provides information on the presence of daylight or darkness at a given time.
Temp / Wind / Dewpoint
Temperature, wind, and dew point analysis involves the assessment of these fundamental weather parameters to understand atmospheric conditions and their impact on local weather. Here’s a list of number values associated with these analyses and their interpretations:
-
Temperature (in degrees Celsius or Fahrenheit):
- High values indicate warmer conditions, while low values suggest cooler weather.
- Rapid temperature changes can signify the approach of a weather front or other dynamic atmospheric conditions.
-
Wind Speed (in knots or miles per hour):
- Low wind speeds suggest calm conditions, while high speeds indicate stronger winds.
- Wind direction provides insights into the origin of air masses and potential weather patterns.
-
Dew Point (in degrees Celsius or Fahrenheit):
- A high dew point indicates higher humidity levels and a more uncomfortable, muggy environment.
- A low dew point signifies drier air and can be associated with clearer skies.
3-Hour Temperature Change
The 3-hour temperature change analysis is a crucial tool used to assess how rapidly temperatures are shifting over a specific period, typically within a three-hour timeframe. It plays a vital role in weather monitoring and forecasting. Here’s a list of number values associated with 3-hour temperature change and their implications:
-
Positive Change (in degrees Celsius or Fahrenheit):
- A positive value indicates that temperatures have risen over the past three hours.
- It suggests a warming trend and may be linked to improving weather conditions.
-
Negative Change (in degrees Celsius or Fahrenheit):
- A negative value signifies a drop in temperatures during the past three hours.
- It implies a cooling trend and may be associated with deteriorating weather conditions, like the arrival of a cold front.
-
Zero Change (0 degrees Celsius or Fahrenheit):
- A value of zero suggests little to no change in temperature over the specified time frame.
3-Hour Dewpoint Change
The 3-hour dew point change analysis is a tool used to evaluate how quickly dew point temperatures have altered over a three-hour timeframe. Dew point is a measure of humidity, and this analysis is vital for understanding changes in atmospheric moisture and their impact on weather conditions. Here’s a list of number values associated with the 3-hour dew point change and their interpretations:
-
Positive Change (in degrees Celsius or Fahrenheit):
- A positive value indicates an increase in dew point temperature over the past three hours.
- It signifies a rise in humidity, potentially leading to more uncomfortable or muggy conditions.
-
Negative Change (in degrees Celsius or Fahrenheit):
- A negative value suggests a decrease in dew point temperatures within the last three hours.
- It indicates a reduction in humidity and the potential for drier, more comfortable conditions.
-
Zero Change (0 degrees Celsius or Fahrenheit):
- A value of zero signifies little to no change in dew point temperature over the specified time frame.
Drought Monitor
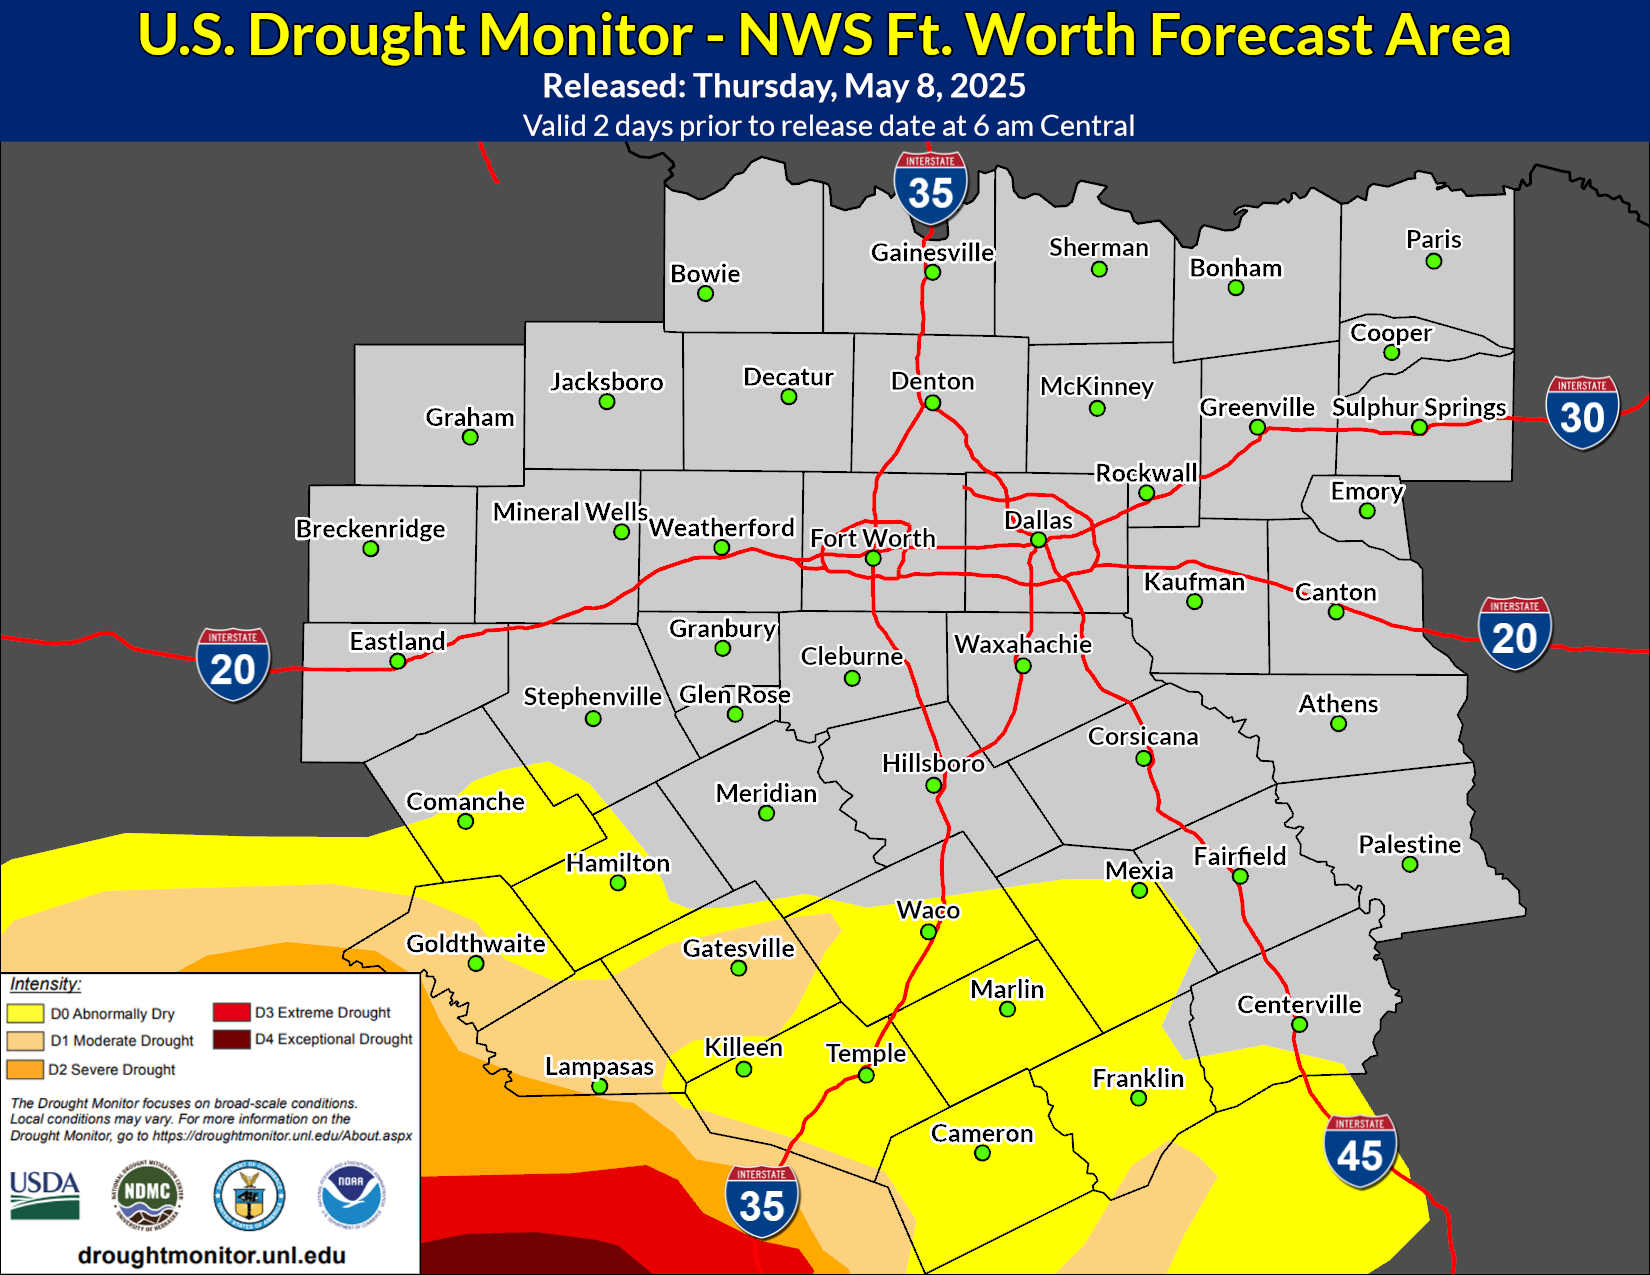
The Drought Monitor is a tool that assesses and communicates the extent and severity of drought conditions across various regions, aiding in the management of water resources, agriculture, and public safety. It relies on a combination of data and expert analysis to categorize drought severity, ranging from abnormally dry to exceptional drought. Here’s a list of number values associated with the Drought Monitor and what they signify:
-
D0 (Abnormally Dry):
- Slightly drier than usual conditions with short-term dryness.
- May signal the early stages of drought.
-
D1 (Moderate Drought):
- Continued dryness leading to reduced water supply and stress on crops and ecosystems.
- Increased potential for water use restrictions.
-
D2 (Severe Drought):
- Widespread water shortages, with major crop and pasture losses.
- Imminent water use restrictions and potentially damaging impacts on ecosystems.
-
D3 (Extreme Drought):
- Major water deficits, widespread crop and pasture loss, and water emergencies.
- Significant water use restrictions and threats to water supplies.
-
D4 (Exceptional Drought):
- Exceptional and widespread water shortages, devastating impacts on agriculture, and severe water emergencies.
- High likelihood of catastrophic water supply and ecosystem damage.
-
Weather Sounding
-
Bulk Wind Shear
-
SR Helicity
-
850mb Temp Advection
-
850mb Analysis
-
Surface Observations
-
Visible Satellite
-
Temp / Wind / Dewpoint
-
3-Hour Temperature Change
-
3-Hour Dewpoint Change
-
Drought Monitor
Weather Sounding
A Weather Sounding is a reading gathered by a weather balloon that creates an atmospherics profile of various kinds of weather data. These soundings (below) gather temperature, dewpoint, moisture, wind speed, wind direction, and various severe storm ingredients present in the atmosphere. All this upper-air data is gathered by radiosondes which are on weather balloons that launch at NWS offices nationwide 2-3 times daily (sometimes dependent on station). This chart may be very confusing and foreign to some. For a tutorial to understand the WC Tornado Center graph below, view WC’s page on “How to Read a Weather Sounding” (coming soon)
Some basic things to look for on a Weather Sounding for tornado forecasting would be:
- Generally high CAPE (Convective Available Potential Energy). Values around 2500+ CAPE is favorable to tornado development due to the high instability in the atmosphere. Find this value under Most Unstable CAPE (MU CAPE)
- K-Index of 26 or higher. K-Index is another method of measuring instability in the atmosphere.
- Lifted Index (LI) of less than -4. Measures the ability for a parcel to lift in the atmosphere.
- Hodograph critical angle as close to 90 degrees as possible. This indicates good wind shear for tornadoes.
- BRN Shear between 20-45 m/s.
- The red temperature line is not overlapping the brown dotted rising air parcel line down closer to the surface. If it was overlapping, it would indicate that there is Convective Inhibition (Inverse CAPE). Whenever this exists, it will prevent severe storm development and the CAPE will hold.
- SARS Sounding Analog indicating matches for SUPERCELL and SGFNT HAIL.
- Any of these categories colored orange or red: Supercell, Left Supercell, STP, and Sig Hail.
Bulk Wind Shear
Bulk Wind Shear is the change in wind speed or direction in the lower part of the atmosphere where storm development will first develop (first 3.5 miles). This map displays the effective values. Any values 40 Knots or more is favorable environment for supercell development. The larger the number, the more shear there is which results in better potential for supercell development.
Some basic things to look for on these maps for tornado forecasting would be:
- Bulk Shear values of 40+ Knots
SR Helicity
In the realm of meteorology, SR helicity, or Storm-Relative Helicity, is a critical parameter used to assess the potential for rotating updrafts within severe thunderstorms. It quantifies the relative spin in the atmosphere by considering the vertical wind shear and storm motion in a given region. High SR helicity values indicate a favorable environment for the development of supercell thunderstorms. Storm-Relative Helicity (SRH) is such a crucial parameter in that helps assess the potential for rotating updrafts in thunderstorms. SRH values provide insight into the atmosphere’s propensity for severe weather, particularly tornadoes. Here’s a general list of what different SR Helicity numbers may imply:
-
Low SR Helicity (0-100 m²/s²):
- Limited or no potential for rotating updrafts.
- Thunderstorms are less likely to produce tornadoes.
-
Moderate SR Helicity (100-200 m²/s²):
- A modest potential for rotating updrafts.
- Isolated tornadoes may be possible but not guaranteed.
-
High SR Helicity (200-400 m²/s²):
- A significant potential for rotating updrafts.
- Conditions are favorable for supercell development and tornado formation.
-
Very High SR Helicity (400 m²/s² and above):
- An extremely favorable environment for rotating updrafts.
- Increased likelihood of strong and long-lived tornadoes.
850mb Temp Advection
850mb Temperature Advection is a critical meteorological parameter that describes the horizontal movement of temperature changes within the atmosphere at the 850 millibar pressure level, which typically resides a few thousand feet above the Earth’s surface. This concept is indispensable for weather forecasting as it provides insights into evolving temperature patterns and their impact on local weather.
Here’s a breakdown of what different 850mb temperature advection values mean:
- Positive Advection: When positive values are observed, it indicates the horizontal transport of warmer air into an area. This results in increasing temperatures and can lead to more favorable conditions for convective processes and potentially rising temperatures.
- Negative Advection: Negative values signify the horizontal transport of cooler air into a region. This results in decreasing temperatures and can lead to cooling trends and potentially less favorable conditions for convective processes.
- Weak Advection: When the values are close to zero, it suggests minimal temperature changes and relatively stable weather conditions.
- Strong Advection: Large positive or negative values imply significant temperature variations are expected. This can indicate more dynamic weather patterns, including the potential for temperature-driven weather events like thunderstorms or temperature drops leading to cold fronts.
850mb Analysis
850mb analysis, in meteorology, refers to the examination and interpretation of various atmospheric parameters at the 850 millibar pressure level, which typically occurs several thousand feet above the Earth’s surface. This analysis is instrumental in weather forecasting, offering critical insights into atmospheric conditions. Here’s a list of number values associated with 850mb analysis and their implications:
-
Temperature (in degrees Celsius):
- Positive values suggest warmer air at that level.
- Negative values indicate cooler air.
-
Dew Point (in degrees Celsius):
- A higher dew point suggests more moisture at this level.
- A lower dew point indicates drier air.
-
Wind Speed (in knots):
- Wind speed and direction provide information about horizontal wind flow, influencing weather systems.
-
Relative Humidity (as a percentage):
- High values suggest more saturated air.
- Low values indicate drier conditions.
Surface Observations
Surface observations refer to the collection of real-time weather data at or near the Earth’s surface. These data are crucial for weather forecasting, climate analysis, and monitoring local weather conditions. Surface observations typically include the following key parameters:
- Temperature (in degrees Celsius): The current air temperature provides information about how hot or cold it is at a specific location.
- Dew Point (in degrees Celsius): The dew point temperature indicates the air’s moisture content, with higher values signifying more humidity.
- Wind Speed (in knots or miles per hour): Wind speed and direction offer insights into the movement of air, influencing weather patterns.
- Relative Humidity (as a percentage): Relative humidity measures the air’s moisture content concerning its capacity to hold moisture, with higher values suggesting more saturation.
- Barometric Pressure (in hPa or mb): Barometric pressure reveals the weight of the atmosphere at a particular location and helps identify high or low-pressure systems.
- Precipitation (in inches or millimeters): Precipitation data record the amount of rain, snow, or other forms of moisture falling to the ground.
- Visibility (in miles or meters): Visibility describes how far one can see due to atmospheric conditions like fog, rain, or snow.
Visible Satellite
The Visible Satellite is a weather observation tool that captures images of the Earth’s surface and cloud cover in the visible spectrum of light. It’s a valuable resource for meteorologists and weather enthusiasts, aiding in the monitoring and analysis of weather systems and conditions. Here’s a list of number values associated with Visible Satellite imagery and what they signify:
- Brightness Temperature (in degrees Celsius): The brightness temperature is derived from the satellite’s sensor data and can indicate cloud cover and surface temperature. Lower values are often associated with cooler surfaces.
- Reflectance Values (in percentages): These values represent the amount of sunlight reflected by various surfaces, including land, water, and clouds. High values indicate highly reflective surfaces like snow or ice.
- Cloud Cover (in percentages): The extent of cloud cover, often categorized as clear, partly cloudy, or overcast, is determined by analyzing the brightness and texture of cloud formations.
- Daylight/Darkness: Visible satellite imagery is only available during daylight hours, so it provides information on the presence of daylight or darkness at a given time.
Temp / Wind / Dewpoint
Temperature, wind, and dew point analysis involves the assessment of these fundamental weather parameters to understand atmospheric conditions and their impact on local weather. Here’s a list of number values associated with these analyses and their interpretations:
-
Temperature (in degrees Celsius or Fahrenheit):
- High values indicate warmer conditions, while low values suggest cooler weather.
- Rapid temperature changes can signify the approach of a weather front or other dynamic atmospheric conditions.
-
Wind Speed (in knots or miles per hour):
- Low wind speeds suggest calm conditions, while high speeds indicate stronger winds.
- Wind direction provides insights into the origin of air masses and potential weather patterns.
-
Dew Point (in degrees Celsius or Fahrenheit):
- A high dew point indicates higher humidity levels and a more uncomfortable, muggy environment.
- A low dew point signifies drier air and can be associated with clearer skies.
3-Hour Temperature Change
The 3-hour temperature change analysis is a crucial tool used to assess how rapidly temperatures are shifting over a specific period, typically within a three-hour timeframe. It plays a vital role in weather monitoring and forecasting. Here’s a list of number values associated with 3-hour temperature change and their implications:
-
Positive Change (in degrees Celsius or Fahrenheit):
- A positive value indicates that temperatures have risen over the past three hours.
- It suggests a warming trend and may be linked to improving weather conditions.
-
Negative Change (in degrees Celsius or Fahrenheit):
- A negative value signifies a drop in temperatures during the past three hours.
- It implies a cooling trend and may be associated with deteriorating weather conditions, like the arrival of a cold front.
-
Zero Change (0 degrees Celsius or Fahrenheit):
- A value of zero suggests little to no change in temperature over the specified time frame.
3-Hour Dewpoint Change
The 3-hour dew point change analysis is a tool used to evaluate how quickly dew point temperatures have altered over a three-hour timeframe. Dew point is a measure of humidity, and this analysis is vital for understanding changes in atmospheric moisture and their impact on weather conditions. Here’s a list of number values associated with the 3-hour dew point change and their interpretations:
-
Positive Change (in degrees Celsius or Fahrenheit):
- A positive value indicates an increase in dew point temperature over the past three hours.
- It signifies a rise in humidity, potentially leading to more uncomfortable or muggy conditions.
-
Negative Change (in degrees Celsius or Fahrenheit):
- A negative value suggests a decrease in dew point temperatures within the last three hours.
- It indicates a reduction in humidity and the potential for drier, more comfortable conditions.
-
Zero Change (0 degrees Celsius or Fahrenheit):
- A value of zero signifies little to no change in dew point temperature over the specified time frame.
Drought Monitor
The Drought Monitor is a tool that assesses and communicates the extent and severity of drought conditions across various regions, aiding in the management of water resources, agriculture, and public safety. It relies on a combination of data and expert analysis to categorize drought severity, ranging from abnormally dry to exceptional drought. Here’s a list of number values associated with the Drought Monitor and what they signify:
-
D0 (Abnormally Dry):
- Slightly drier than usual conditions with short-term dryness.
- May signal the early stages of drought.
-
D1 (Moderate Drought):
- Continued dryness leading to reduced water supply and stress on crops and ecosystems.
- Increased potential for water use restrictions.
-
D2 (Severe Drought):
- Widespread water shortages, with major crop and pasture losses.
- Imminent water use restrictions and potentially damaging impacts on ecosystems.
-
D3 (Extreme Drought):
- Major water deficits, widespread crop and pasture loss, and water emergencies.
- Significant water use restrictions and threats to water supplies.
-
D4 (Exceptional Drought):
- Exceptional and widespread water shortages, devastating impacts on agriculture, and severe water emergencies.
- High likelihood of catastrophic water supply and ecosystem damage.
Severe Weather Analysis
-
Surface Based CAPE
-
3-Hour CAPE Change
-

Supercell Composite
-

LCL Height
-
Total Totals
-
K-Index
-
Critical Angle
-
Energy-Helicity Index
-
Showalter Index
-

Significant Hail Chance
-
SARS Hail Size
-
SARS Significant Hail %
-

Significant Tornado
-

Probability of EF0+
-

Probability of EF2+
-

Probability of EF4+
Surface Based CAPE
Surface-Based CAPE, or Convective Available Potential Energy, is a term used to quantify the amount of atmospheric energy available for convective thunderstorm development near the Earth’s surface. It is a key parameter for assessing the potential for severe weather, particularly thunderstorms. Surface-Based CAPE values are expressed in joules per kilogram (J/kg), and they provide insight into the instability and likelihood of storm development. Here’s a list of number values associated with Surface-Based CAPE and their interpretations:
-
Low CAPE (0-500 J/kg):
- Limited potential for strong or severe thunderstorm development.
- Typically results in less intense convective activity.
-
Moderate CAPE (500-1,000 J/kg):
- Favorable for thunderstorms with the potential for heavy rain, lightning, and gusty winds.
- Severe weather is possible but less likely.
-
High CAPE (1,000-2,500 J/kg):
- Indicates a substantial potential for severe thunderstorms with intense updrafts.
- Increased risk of severe weather, including large hail, damaging winds, and tornadoes.
-
Very High CAPE (2,500 J/kg and above):
- Suggests an extremely unstable atmosphere, with a high potential for severe weather events, including supercells and violent thunderstorms.
3-Hour CAPE Change
3-hour CAPE change refers to the assessment of Convective Available Potential Energy (CAPE) over a three-hour time frame. CAPE is a critical meteorological parameter that quantifies the atmospheric energy available for the development of thunderstorms. A change in CAPE over a short period can indicate significant shifts in atmospheric instability, which is crucial for forecasting severe weather. Here’s a list of number values associated with 3-hour CAPE change and their implications:
-
Positive Change (in joules per kilogram, J/kg):
- A positive value indicates an increase in CAPE over the past three hours.
- Suggests growing atmospheric instability, raising the potential for thunderstorm development.
-
Negative Change (in J/kg):
- A negative value signifies a decrease in CAPE within the last three hours.
- Indicates a reduction in atmospheric instability and a potential decline in the likelihood of thunderstorms.
-
Zero Change (0 J/kg):
- A value of zero implies little to no change in CAPE during the specified time frame.
Supercell Composite
The Supercell Composite is an index designed to assess the potential for supercell thunderstorm development. Supercells are severe thunderstorms characterized by rotating updrafts, often associated with tornadoes, large hail, and damaging winds. This index combines various atmospheric parameters to gauge the likelihood of supercell formation. Here’s a list of number values associated with the Supercell Composite and their interpretations:
-
Low Value (0-1):
- Suggests a low likelihood of supercell thunderstorms.
- Typically indicates less favorable conditions for severe weather.
-
Moderate Value (1-3):
- A moderate potential for supercell development.
- Indicates the possibility of severe weather with rotating updrafts.
-
High Value (3-6):
- Suggests a significant potential for supercell thunderstorms.
- Indicates a heightened risk of severe weather events, including tornadoes.
-
Very High Value (6 and above):
- Signifies an extremely favorable environment for supercell development.
- Suggests a high risk of severe weather, often with strong and long-lived tornadoes.
LCL Height
The Lifted Condensation Level (LCL) Height is a critical parameter that helps in assessing cloud base heights and the potential for cloud formation. It represents the altitude at which a parcel of moist air, when lifted, cools to the point where its relative humidity reaches 100%, and condensation occurs, forming clouds. LCL height is vital for forecasting and understanding cloud development and weather patterns. Here’s a list of number values associated with LCL height and their implications:
-
Low LCL Height (below 1,000 meters):
- Suggests cloud formation and potential for low-level clouds.
- Often related to localized weather phenomena and cooler conditions near the surface.
-
Moderate LCL Height (1,000-2,500 meters):
- Typical for the development of mid-level clouds.
- Often associated with more stable and less convective atmospheric conditions.
-
High LCL Height (above 2,500 meters):
- Signifies cloud formation at higher altitudes.
- Indicates potential for convective storms, towering cumulus clouds, and more dynamic atmospheric conditions.
Total Totals
Total Totals (TT) is an index used to assess atmospheric instability and the potential for severe weather, especially convective storms. It is calculated by adding two temperature values and subtracting the dew point temperature. TT values help meteorologists determine the likelihood of thunderstorm development and severe weather. Here’s a list of number values associated with Total Totals and their interpretations:
-
Low TT (below 40):
- Indicates limited atmospheric instability and a lower potential for severe weather.
- Suggests a lower likelihood of intense thunderstorms.
-
Moderate TT (40-50):
- Suggests a moderate level of atmospheric instability.
- A moderate chance of thunderstorm development, potentially leading to strong storms.
-
High TT (50-55):
- Signifies a higher level of atmospheric instability.
- An increased potential for severe weather events, including strong thunderstorms.
-
Very High TT (above 55):
- Indicates an extremely unstable atmosphere with a significant potential for severe weather.
- Suggests a high likelihood of severe storms, including hail, strong winds, and possible tornadoes.
K-Index
The K-index is a valuable parameter used to evaluate atmospheric stability and the potential for thunderstorm development. It helps meteorologists assess the likelihood of severe weather and provides crucial information for weather forecasting. The K-index combines various atmospheric measurements to gauge atmospheric instability, including temperature, dew point, and wind data. Here’s a list of number values associated with the K-index and their implications:
-
Low K-index (0-15):
- Indicates a stable atmosphere with limited potential for thunderstorms.
- Suggests relatively calm and benign weather conditions.
-
Moderate K-index (15-25):
- Signifies a moderately unstable atmosphere with a moderate potential for thunderstorm development.
- Suggests a chance of scattered or non-severe thunderstorms.
-
High K-index (25-35):
- Indicates a higher level of atmospheric instability.
- Suggests an increased likelihood of severe weather, including strong thunderstorms.
-
Very High K-index (above 35):
- Signifies an extremely unstable atmosphere.
- Predicts a high likelihood of severe weather events, such as large hail, damaging winds, and tornadoes.
Critical Angle
The Critical Angle refers to the angle at which a low-level wind approaching an area of severe weather must intersect with storm motion to maximize the potential for supercell thunderstorm development and tornado formation. This concept is essential for understanding atmospheric conditions conducive to severe weather and tornadoes. Here’s a list of number values associated with the Critical Angle and their implications:
-
Small Critical Angle (0-30 degrees):
- A small angle suggests that low-level winds are nearly aligned with the storm’s motion.
- This configuration can enhance the potential for supercell thunderstorms and increase the risk of tornadoes.
-
Moderate Critical Angle (30-60 degrees):
- A moderate angle indicates that low-level winds approach the storm at an angle.
- This scenario offers a reasonable chance for supercell development and tornadoes but may not be as conducive as a smaller critical angle.
-
Large Critical Angle (60-90 degrees):
- A large critical angle suggests that low-level winds intersect the storm’s motion at a significant angle.
- This configuration is less favorable for supercell and tornado development.
Energy-Helicity Index
The Energy-Helicity Index (EHI) is a meteorological parameter that combines measures of both convective available potential energy (CAPE) and helicity. It is used to assess the potential for supercell thunderstorm development and tornado formation. The EHI provides valuable insights into the atmospheric conditions conducive to severe weather events. Here’s a list of number values associated with the Energy-Helicity Index and their interpretations:
-
Low EHI (0-1):
- Suggests a minimal potential for supercell thunderstorms and tornadoes.
- Typically indicates less favorable conditions for severe weather.
-
Moderate EHI (1-5):
- Signifies a moderate potential for supercell development and tornadoes.
- Suggests the possibility of severe weather events.
-
High EHI (5-10):
- Indicates a significant potential for supercell thunderstorms and tornadoes.
- Suggests a heightened risk of severe weather, including the formation of strong tornadoes.
-
Very High EHI (10 and above):
- Signifies an extremely favorable environment for supercell development and severe weather.
- Suggests a high risk of severe weather events, with the potential for violent, long-lived tornadoes.
Showalter Index
The Showalter Index is a parameter that measures the potential for atmospheric instability, specifically focusing on the presence of elevated convection within the atmosphere. It is often used to assess the likelihood of thunderstorm development and severe weather. The Showalter Index takes into account the temperature of a parcel of air lifted to a particular pressure level and compares it to the surrounding air’s temperature at that level. Here’s a list of number values associated with the Showalter Index and their implications:
-
Positive Showalter Index (+1 to +3):
- Suggests a relatively stable atmosphere with limited potential for thunderstorm development.
- Typically indicative of favorable weather conditions.
-
Near Zero Showalter Index (-1 to +1):
- Indicates a marginally unstable atmosphere with a low potential for thunderstorms.
- May lead to isolated or less severe convective activity.
-
Negative Showalter Index (-1 to -3):
- Suggests an unstable atmosphere with a reasonable potential for thunderstorm development.
- May lead to more widespread and potentially severe thunderstorms.
-
Strongly Negative Showalter Index (below -3):
- Signifies a highly unstable atmosphere with a significant potential for severe weather, including strong thunderstorms and severe hail.
Significant Hail Chance
The Significant Hail Chance (SHC) is a parameter used to assess the likelihood of significant hail formation in a given area. Hail is a type of severe weather event that can cause substantial damage to crops, vehicles, buildings, and pose a threat to human safety. The SHC provides valuable information to meteorologists and the public to prepare for such events. Here’s a list of number values associated with the Significant Hail Chance and their implications:
-
Low SHC (0-10%):
- Suggests a low likelihood of significant hail formation.
- Typically associated with benign or non-severe weather conditions.
-
Moderate SHC (10-30%):
- Indicates a moderate potential for significant hail.
- May lead to sporadic hail events, but they are not expected to be widespread or severe.
-
High SHC (30-50%):
- Signifies a substantial likelihood of significant hail.
- Implies a heightened risk of hailstorms, which can lead to local damage.
-
Very High SHC (above 50%):
- Indicates an extremely favorable environment for significant hail.
- Suggests a high risk of severe hail events, with the potential for large hailstones that can cause extensive damage.
SARS Hail Size
SARS Hail Size (Supercell Composite Reflectivity of the Maximum Expected Hail Size) is a parameter used to predict the size of hail that may occur within a severe thunderstorm. Hailstorms can be particularly destructive, causing damage to crops, vehicles, and structures. The SARS Hail Size parameter helps meteorologists and the public anticipate the potential impact of hail within a given storm. Here’s a list of number values associated with SARS Hail Size and their implications:
-
Small Hail (less than 1 inch or 2.5 cm):
- SARS Hail Size values at the lower end suggest the likelihood of small hail.
- Typically results in minimal property damage and a low risk to public safety.
-
Moderate Hail (1-1.5 inches or 2.5-3.8 cm):
- SARS Hail Size values in this range indicate the potential for moderate-sized hailstones.
- May cause some damage to vehicles and minor property damage.
-
Large Hail (1.5-2 inches or 3.8-5 cm):
- Suggests the likelihood of large hail that can cause significant damage to vehicles and property.
- May pose a risk to public safety.
-
Very Large Hail (2 inches or more or 5 cm and above):
- SARS Hail Size values at the upper end indicate the potential for very large hailstones.
- These hailstones can cause extensive damage, pose a severe risk to public safety, and result in significant financial losses.
SARS Significant Hail %
The SARS Significant Hail Chance (Supercell Composite Reflectivity Significant Hail Chance) is a parameter used to estimate the likelihood of significant hail occurring within a severe thunderstorm. Hail can cause extensive damage to property, crops, and pose risks to human safety. The SARS Significant Hail Chance parameter helps meteorologists and the public prepare for and respond to hailstorms. Here’s a list of number values associated with the SARS Significant Hail Chance and their interpretations:
-
Low Significant Hail Chance (0-10%):
- Suggests a low probability of significant hail formation.
- Typically associated with benign or non-severe weather conditions.
-
Moderate Significant Hail Chance (10-30%):
- Indicates a moderate potential for significant hail.
- May result in sporadic hail events but not expected to be widespread or particularly severe.
-
High Significant Hail Chance (30-50%):
- Signifies a substantial likelihood of significant hail.
- Implies an increased risk of hailstorms, which can lead to local damage.
-
Very High Significant Hail Chance (above 50%):
- Indicates an extremely favorable environment for significant hail.
- Suggests a high risk of severe hail events with the potential for large, damaging hailstones.
Significant Tornado
The Significant Tornado parameter, often referred to as SigTornado, is an index used to assess the potential for significant and violent tornadoes within a severe thunderstorm or supercell. Tornadoes are among the most destructive and life-threatening weather phenomena, and predicting their severity is crucial for public safety and preparedness. Here’s a list of number values associated with the Significant Tornado parameter and their interpretations:
-
Low SigTornado (0-1):
- Suggests a low likelihood of significant tornado development.
- Typically indicative of benign or non-severe weather conditions.
-
Moderate SigTornado (1-3):
- Indicates a moderate potential for significant tornadoes.
- Suggests a chance of isolated or non-severe tornado events.
-
High SigTornado (3-6):
- Signifies a substantial likelihood of significant tornado development.
- Implies an increased risk of tornadoes, including potentially strong ones.
-
Very High SigTornado (above 6):
- Indicates an extremely favorable environment for significant and violent tornadoes.
- Suggests a high risk of severe tornado events, including long-lived and violent ones.
Probability of EF0+
The Probability of EF-0 Tornado is a meteorological parameter used to estimate the likelihood of a tornado occurring at the EF-0 intensity level on the Enhanced Fujita (EF) scale. EF-0 tornadoes are the weakest on the scale, with wind speeds between 65 and 85 miles per hour (105-137 km/h). While they are less destructive than stronger tornadoes, EF-0 tornadoes can still cause damage to buildings and vegetation. Here’s a list of number values associated with the Probability of EF-0 Tornado and their implications:
-
Low Probability (0-10%):
- Suggests a low chance of an EF-0 tornado occurring.
- Typically indicative of non-severe or benign weather conditions.
-
Moderate Probability (10-30%):
- Indicates a moderate chance of an EF-0 tornado.
- Suggests the potential for isolated EF-0 tornadoes within a given area.
-
High Probability (30-50%):
- Signifies a substantial likelihood of EF-0 tornado development.
- Implies an increased risk of EF-0 tornadoes, often associated with severe weather events.
-
Very High Probability (above 50%):
- Indicates an extremely favorable environment for EF-0 tornadoes.
- Suggests a high risk of EF-0 tornadoes, often associated with more significant severe weather outbreaks.
Probability of EF2+

The Probability of EF-2 Tornado is a meteorological parameter used to estimate the likelihood of a tornado occurring at the EF-2 intensity level on the Enhanced Fujita (EF) scale. EF-2 tornadoes are characterized by wind speeds between 111 and 135 miles per hour (179-217 km/h) and can cause significant damage to buildings and vegetation. Here’s a list of number values associated with the Probability of EF-2 Tornado and their implications:
-
Low Probability (0-10%):
- Suggests a low chance of an EF-2 tornado occurring.
- Typically indicative of non-severe or benign weather conditions.
-
Moderate Probability (10-30%):
- Indicates a moderate chance of an EF-2 tornado.
- Suggests the potential for isolated EF-2 tornadoes within a given area.
-
High Probability (30-50%):
- Signifies a substantial likelihood of EF-2 tornado development.
- Implies an increased risk of EF-2 tornadoes, often associated with severe weather events.
-
Very High Probability (above 50%):
- Indicates an extremely favorable environment for EF-2 tornadoes.
- Suggests a high risk of EF-2 tornadoes, often associated with more significant severe weather outbreaks.
Probability of EF4+
The Probability of EF-4 Tornado is a meteorological parameter used to assess the likelihood of a tornado occurring at the EF-4 intensity level on the Enhanced Fujita (EF) scale. EF-4 tornadoes are characterized by violent wind speeds ranging from 166 to 200 miles per hour (267-322 km/h). These tornadoes can cause extensive damage to buildings and landscapes and pose a significant threat to life and safety. Here’s a list of number values associated with the Probability of EF-4 Tornado and their implications:
-
Low Probability (0-10%):
- Suggests a low chance of an EF-4 tornado occurring.
- Typically indicative of non-severe or benign weather conditions.
-
Moderate Probability (10-30%):
- Indicates a moderate chance of an EF-4 tornado.
- Suggests the potential for isolated EF-4 tornadoes within a given area.
-
High Probability (30-50%):
- Signifies a substantial likelihood of EF-4 tornado development.
- Implies an increased risk of EF-4 tornadoes, often associated with severe weather events.
-
Very High Probability (above 50%):
- Indicates an extremely favorable environment for EF-4 tornadoes.
- Suggests a high risk of EF-4 tornadoes, often linked to significant and severe weather outbreaks.
Surface Based CAPE
Surface-Based CAPE, or Convective Available Potential Energy, is a term used to quantify the amount of atmospheric energy available for convective thunderstorm development near the Earth’s surface. It is a key parameter for assessing the potential for severe weather, particularly thunderstorms. Surface-Based CAPE values are expressed in joules per kilogram (J/kg), and they provide insight into the instability and likelihood of storm development. Here’s a list of number values associated with Surface-Based CAPE and their interpretations:
-
Low CAPE (0-500 J/kg):
- Limited potential for strong or severe thunderstorm development.
- Typically results in less intense convective activity.
-
Moderate CAPE (500-1,000 J/kg):
- Favorable for thunderstorms with the potential for heavy rain, lightning, and gusty winds.
- Severe weather is possible but less likely.
-
High CAPE (1,000-2,500 J/kg):
- Indicates a substantial potential for severe thunderstorms with intense updrafts.
- Increased risk of severe weather, including large hail, damaging winds, and tornadoes.
-
Very High CAPE (2,500 J/kg and above):
- Suggests an extremely unstable atmosphere, with a high potential for severe weather events, including supercells and violent thunderstorms.
3-Hour CAPE Change
3-hour CAPE change refers to the assessment of Convective Available Potential Energy (CAPE) over a three-hour time frame. CAPE is a critical meteorological parameter that quantifies the atmospheric energy available for the development of thunderstorms. A change in CAPE over a short period can indicate significant shifts in atmospheric instability, which is crucial for forecasting severe weather. Here’s a list of number values associated with 3-hour CAPE change and their implications:
-
Positive Change (in joules per kilogram, J/kg):
- A positive value indicates an increase in CAPE over the past three hours.
- Suggests growing atmospheric instability, raising the potential for thunderstorm development.
-
Negative Change (in J/kg):
- A negative value signifies a decrease in CAPE within the last three hours.
- Indicates a reduction in atmospheric instability and a potential decline in the likelihood of thunderstorms.
-
Zero Change (0 J/kg):
- A value of zero implies little to no change in CAPE during the specified time frame.
Supercell Composite
The Supercell Composite is an index designed to assess the potential for supercell thunderstorm development. Supercells are severe thunderstorms characterized by rotating updrafts, often associated with tornadoes, large hail, and damaging winds. This index combines various atmospheric parameters to gauge the likelihood of supercell formation. Here’s a list of number values associated with the Supercell Composite and their interpretations:
-
Low Value (0-1):
- Suggests a low likelihood of supercell thunderstorms.
- Typically indicates less favorable conditions for severe weather.
-
Moderate Value (1-3):
- A moderate potential for supercell development.
- Indicates the possibility of severe weather with rotating updrafts.
-
High Value (3-6):
- Suggests a significant potential for supercell thunderstorms.
- Indicates a heightened risk of severe weather events, including tornadoes.
-
Very High Value (6 and above):
- Signifies an extremely favorable environment for supercell development.
- Suggests a high risk of severe weather, often with strong and long-lived tornadoes.
LCL Height
The Lifted Condensation Level (LCL) Height is a critical parameter that helps in assessing cloud base heights and the potential for cloud formation. It represents the altitude at which a parcel of moist air, when lifted, cools to the point where its relative humidity reaches 100%, and condensation occurs, forming clouds. LCL height is vital for forecasting and understanding cloud development and weather patterns. Here’s a list of number values associated with LCL height and their implications:
-
Low LCL Height (below 1,000 meters):
- Suggests cloud formation and potential for low-level clouds.
- Often related to localized weather phenomena and cooler conditions near the surface.
-
Moderate LCL Height (1,000-2,500 meters):
- Typical for the development of mid-level clouds.
- Often associated with more stable and less convective atmospheric conditions.
-
High LCL Height (above 2,500 meters):
- Signifies cloud formation at higher altitudes.
- Indicates potential for convective storms, towering cumulus clouds, and more dynamic atmospheric conditions.
Total Totals
Total Totals (TT) is an index used to assess atmospheric instability and the potential for severe weather, especially convective storms. It is calculated by adding two temperature values and subtracting the dew point temperature. TT values help meteorologists determine the likelihood of thunderstorm development and severe weather. Here’s a list of number values associated with Total Totals and their interpretations:
-
Low TT (below 40):
- Indicates limited atmospheric instability and a lower potential for severe weather.
- Suggests a lower likelihood of intense thunderstorms.
-
Moderate TT (40-50):
- Suggests a moderate level of atmospheric instability.
- A moderate chance of thunderstorm development, potentially leading to strong storms.
-
High TT (50-55):
- Signifies a higher level of atmospheric instability.
- An increased potential for severe weather events, including strong thunderstorms.
-
Very High TT (above 55):
- Indicates an extremely unstable atmosphere with a significant potential for severe weather.
- Suggests a high likelihood of severe storms, including hail, strong winds, and possible tornadoes.
K-Index
The K-index is a valuable parameter used to evaluate atmospheric stability and the potential for thunderstorm development. It helps meteorologists assess the likelihood of severe weather and provides crucial information for weather forecasting. The K-index combines various atmospheric measurements to gauge atmospheric instability, including temperature, dew point, and wind data. Here’s a list of number values associated with the K-index and their implications:
-
Low K-index (0-15):
- Indicates a stable atmosphere with limited potential for thunderstorms.
- Suggests relatively calm and benign weather conditions.
-
Moderate K-index (15-25):
- Signifies a moderately unstable atmosphere with a moderate potential for thunderstorm development.
- Suggests a chance of scattered or non-severe thunderstorms.
-
High K-index (25-35):
- Indicates a higher level of atmospheric instability.
- Suggests an increased likelihood of severe weather, including strong thunderstorms.
-
Very High K-index (above 35):
- Signifies an extremely unstable atmosphere.
- Predicts a high likelihood of severe weather events, such as large hail, damaging winds, and tornadoes.
Critical Angle
The Critical Angle refers to the angle at which a low-level wind approaching an area of severe weather must intersect with storm motion to maximize the potential for supercell thunderstorm development and tornado formation. This concept is essential for understanding atmospheric conditions conducive to severe weather and tornadoes. Here’s a list of number values associated with the Critical Angle and their implications:
-
Small Critical Angle (0-30 degrees):
- A small angle suggests that low-level winds are nearly aligned with the storm’s motion.
- This configuration can enhance the potential for supercell thunderstorms and increase the risk of tornadoes.
-
Moderate Critical Angle (30-60 degrees):
- A moderate angle indicates that low-level winds approach the storm at an angle.
- This scenario offers a reasonable chance for supercell development and tornadoes but may not be as conducive as a smaller critical angle.
-
Large Critical Angle (60-90 degrees):
- A large critical angle suggests that low-level winds intersect the storm’s motion at a significant angle.
- This configuration is less favorable for supercell and tornado development.
Energy-Helicity Index
The Energy-Helicity Index (EHI) is a meteorological parameter that combines measures of both convective available potential energy (CAPE) and helicity. It is used to assess the potential for supercell thunderstorm development and tornado formation. The EHI provides valuable insights into the atmospheric conditions conducive to severe weather events. Here’s a list of number values associated with the Energy-Helicity Index and their interpretations:
-
Low EHI (0-1):
- Suggests a minimal potential for supercell thunderstorms and tornadoes.
- Typically indicates less favorable conditions for severe weather.
-
Moderate EHI (1-5):
- Signifies a moderate potential for supercell development and tornadoes.
- Suggests the possibility of severe weather events.
-
High EHI (5-10):
- Indicates a significant potential for supercell thunderstorms and tornadoes.
- Suggests a heightened risk of severe weather, including the formation of strong tornadoes.
-
Very High EHI (10 and above):
- Signifies an extremely favorable environment for supercell development and severe weather.
- Suggests a high risk of severe weather events, with the potential for violent, long-lived tornadoes.
Showalter Index
The Showalter Index is a parameter that measures the potential for atmospheric instability, specifically focusing on the presence of elevated convection within the atmosphere. It is often used to assess the likelihood of thunderstorm development and severe weather. The Showalter Index takes into account the temperature of a parcel of air lifted to a particular pressure level and compares it to the surrounding air’s temperature at that level. Here’s a list of number values associated with the Showalter Index and their implications:
-
Positive Showalter Index (+1 to +3):
- Suggests a relatively stable atmosphere with limited potential for thunderstorm development.
- Typically indicative of favorable weather conditions.
-
Near Zero Showalter Index (-1 to +1):
- Indicates a marginally unstable atmosphere with a low potential for thunderstorms.
- May lead to isolated or less severe convective activity.
-
Negative Showalter Index (-1 to -3):
- Suggests an unstable atmosphere with a reasonable potential for thunderstorm development.
- May lead to more widespread and potentially severe thunderstorms.
-
Strongly Negative Showalter Index (below -3):
- Signifies a highly unstable atmosphere with a significant potential for severe weather, including strong thunderstorms and severe hail.
Significant Hail Chance
The Significant Hail Chance (SHC) is a parameter used to assess the likelihood of significant hail formation in a given area. Hail is a type of severe weather event that can cause substantial damage to crops, vehicles, buildings, and pose a threat to human safety. The SHC provides valuable information to meteorologists and the public to prepare for such events. Here’s a list of number values associated with the Significant Hail Chance and their implications:
-
Low SHC (0-10%):
- Suggests a low likelihood of significant hail formation.
- Typically associated with benign or non-severe weather conditions.
-
Moderate SHC (10-30%):
- Indicates a moderate potential for significant hail.
- May lead to sporadic hail events, but they are not expected to be widespread or severe.
-
High SHC (30-50%):
- Signifies a substantial likelihood of significant hail.
- Implies a heightened risk of hailstorms, which can lead to local damage.
-
Very High SHC (above 50%):
- Indicates an extremely favorable environment for significant hail.
- Suggests a high risk of severe hail events, with the potential for large hailstones that can cause extensive damage.
SARS Hail Size
SARS Hail Size (Supercell Composite Reflectivity of the Maximum Expected Hail Size) is a parameter used to predict the size of hail that may occur within a severe thunderstorm. Hailstorms can be particularly destructive, causing damage to crops, vehicles, and structures. The SARS Hail Size parameter helps meteorologists and the public anticipate the potential impact of hail within a given storm. Here’s a list of number values associated with SARS Hail Size and their implications:
-
Small Hail (less than 1 inch or 2.5 cm):
- SARS Hail Size values at the lower end suggest the likelihood of small hail.
- Typically results in minimal property damage and a low risk to public safety.
-
Moderate Hail (1-1.5 inches or 2.5-3.8 cm):
- SARS Hail Size values in this range indicate the potential for moderate-sized hailstones.
- May cause some damage to vehicles and minor property damage.
-
Large Hail (1.5-2 inches or 3.8-5 cm):
- Suggests the likelihood of large hail that can cause significant damage to vehicles and property.
- May pose a risk to public safety.
-
Very Large Hail (2 inches or more or 5 cm and above):
- SARS Hail Size values at the upper end indicate the potential for very large hailstones.
- These hailstones can cause extensive damage, pose a severe risk to public safety, and result in significant financial losses.
SARS Significant Hail %
The SARS Significant Hail Chance (Supercell Composite Reflectivity Significant Hail Chance) is a parameter used to estimate the likelihood of significant hail occurring within a severe thunderstorm. Hail can cause extensive damage to property, crops, and pose risks to human safety. The SARS Significant Hail Chance parameter helps meteorologists and the public prepare for and respond to hailstorms. Here’s a list of number values associated with the SARS Significant Hail Chance and their interpretations:
-
Low Significant Hail Chance (0-10%):
- Suggests a low probability of significant hail formation.
- Typically associated with benign or non-severe weather conditions.
-
Moderate Significant Hail Chance (10-30%):
- Indicates a moderate potential for significant hail.
- May result in sporadic hail events but not expected to be widespread or particularly severe.
-
High Significant Hail Chance (30-50%):
- Signifies a substantial likelihood of significant hail.
- Implies an increased risk of hailstorms, which can lead to local damage.
-
Very High Significant Hail Chance (above 50%):
- Indicates an extremely favorable environment for significant hail.
- Suggests a high risk of severe hail events with the potential for large, damaging hailstones.
Significant Tornado
The Significant Tornado parameter, often referred to as SigTornado, is an index used to assess the potential for significant and violent tornadoes within a severe thunderstorm or supercell. Tornadoes are among the most destructive and life-threatening weather phenomena, and predicting their severity is crucial for public safety and preparedness. Here’s a list of number values associated with the Significant Tornado parameter and their interpretations:
-
Low SigTornado (0-1):
- Suggests a low likelihood of significant tornado development.
- Typically indicative of benign or non-severe weather conditions.
-
Moderate SigTornado (1-3):
- Indicates a moderate potential for significant tornadoes.
- Suggests a chance of isolated or non-severe tornado events.
-
High SigTornado (3-6):
- Signifies a substantial likelihood of significant tornado development.
- Implies an increased risk of tornadoes, including potentially strong ones.
-
Very High SigTornado (above 6):
- Indicates an extremely favorable environment for significant and violent tornadoes.
- Suggests a high risk of severe tornado events, including long-lived and violent ones.
Probability of EF0+
The Probability of EF-0 Tornado is a meteorological parameter used to estimate the likelihood of a tornado occurring at the EF-0 intensity level on the Enhanced Fujita (EF) scale. EF-0 tornadoes are the weakest on the scale, with wind speeds between 65 and 85 miles per hour (105-137 km/h). While they are less destructive than stronger tornadoes, EF-0 tornadoes can still cause damage to buildings and vegetation. Here’s a list of number values associated with the Probability of EF-0 Tornado and their implications:
-
Low Probability (0-10%):
- Suggests a low chance of an EF-0 tornado occurring.
- Typically indicative of non-severe or benign weather conditions.
-
Moderate Probability (10-30%):
- Indicates a moderate chance of an EF-0 tornado.
- Suggests the potential for isolated EF-0 tornadoes within a given area.
-
High Probability (30-50%):
- Signifies a substantial likelihood of EF-0 tornado development.
- Implies an increased risk of EF-0 tornadoes, often associated with severe weather events.
-
Very High Probability (above 50%):
- Indicates an extremely favorable environment for EF-0 tornadoes.
- Suggests a high risk of EF-0 tornadoes, often associated with more significant severe weather outbreaks.
Probability of EF2+
The Probability of EF-2 Tornado is a meteorological parameter used to estimate the likelihood of a tornado occurring at the EF-2 intensity level on the Enhanced Fujita (EF) scale. EF-2 tornadoes are characterized by wind speeds between 111 and 135 miles per hour (179-217 km/h) and can cause significant damage to buildings and vegetation. Here’s a list of number values associated with the Probability of EF-2 Tornado and their implications:
-
Low Probability (0-10%):
- Suggests a low chance of an EF-2 tornado occurring.
- Typically indicative of non-severe or benign weather conditions.
-
Moderate Probability (10-30%):
- Indicates a moderate chance of an EF-2 tornado.
- Suggests the potential for isolated EF-2 tornadoes within a given area.
-
High Probability (30-50%):
- Signifies a substantial likelihood of EF-2 tornado development.
- Implies an increased risk of EF-2 tornadoes, often associated with severe weather events.
-
Very High Probability (above 50%):
- Indicates an extremely favorable environment for EF-2 tornadoes.
- Suggests a high risk of EF-2 tornadoes, often associated with more significant severe weather outbreaks.
Probability of EF4+
The Probability of EF-4 Tornado is a meteorological parameter used to assess the likelihood of a tornado occurring at the EF-4 intensity level on the Enhanced Fujita (EF) scale. EF-4 tornadoes are characterized by violent wind speeds ranging from 166 to 200 miles per hour (267-322 km/h). These tornadoes can cause extensive damage to buildings and landscapes and pose a significant threat to life and safety. Here’s a list of number values associated with the Probability of EF-4 Tornado and their implications:
-
Low Probability (0-10%):
- Suggests a low chance of an EF-4 tornado occurring.
- Typically indicative of non-severe or benign weather conditions.
-
Moderate Probability (10-30%):
- Indicates a moderate chance of an EF-4 tornado.
- Suggests the potential for isolated EF-4 tornadoes within a given area.
-
High Probability (30-50%):
- Signifies a substantial likelihood of EF-4 tornado development.
- Implies an increased risk of EF-4 tornadoes, often associated with severe weather events.
-
Very High Probability (above 50%):
- Indicates an extremely favorable environment for EF-4 tornadoes.
- Suggests a high risk of EF-4 tornadoes, often linked to significant and severe weather outbreaks.